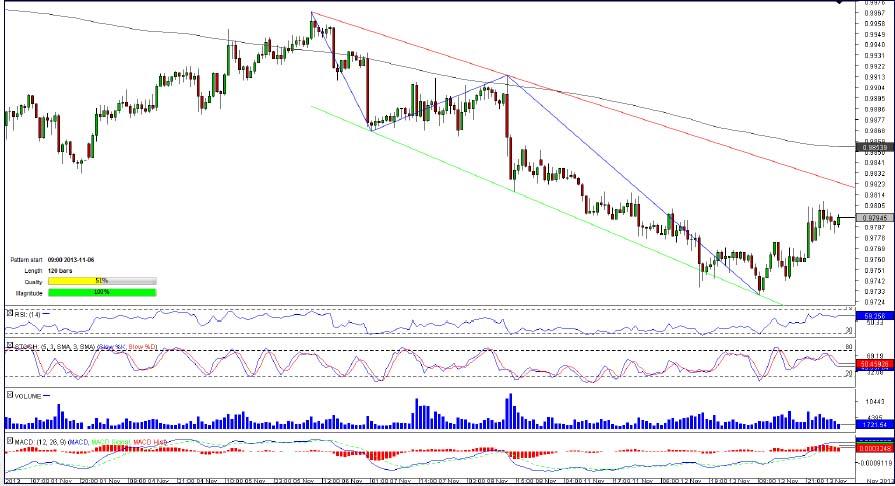
AUD/CAD 1H Chart: Channel Down
Comment: The Australian Dollar was gradually appreciating against its Canadian counterpart during three months ended October 28. In the end of October, the pair reversed its trend to the south; in the beginning of November, the pace of decline accelerated and the pair started to form a channel down pattern. At the moment of writing, the currency couple is trading above its 50-hour SMA that acts as a strong support. Market participants are almost neutral, with 55.56% of them betting on appreciation of the pair. Meanwhile, technical indicators are sending mixed signals, being strongly bullish in the short-term, neutral in the medium tern and bearish in the long-term.
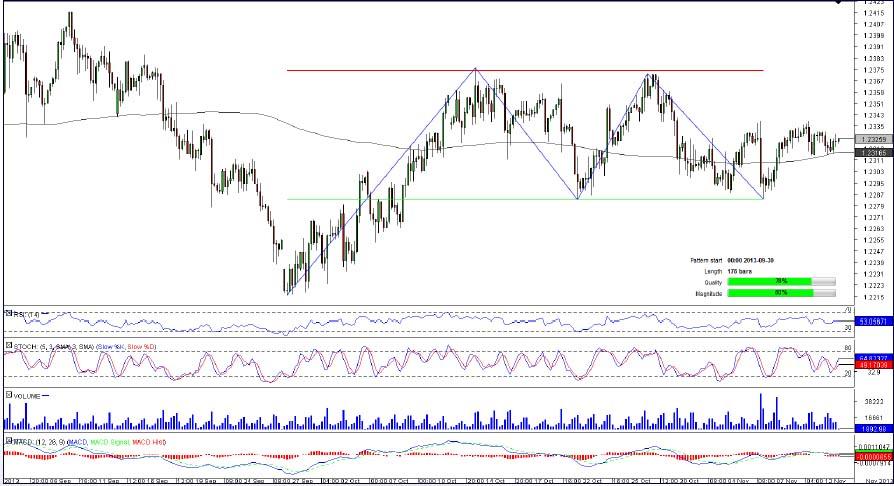
EUR/CHF 4H Chart: Rectangle
Comment: A dive to a four-month low in the very end of September was a starting point of the rectangle pattern formed by EUR/CHF. The pair entered the pattern from below and has touched its boundaries for four times already. Now the currency couple is faltering above its 50- and 200-bar SMAs and is expected to advance by traders who are bullish in 62.44% of cases. However, the death cross that is likely to occur before long given that 50-bar SMA almost fell below 200-bar SMA may defy traders’ expectations. At the same time, technical indicators are neutral in the short-term and bearish in the longer timeframe.
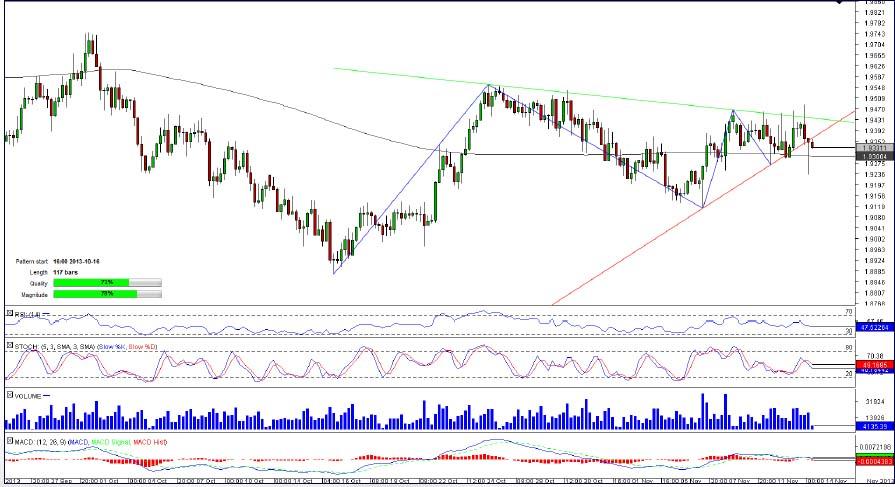
GBP/NZD 4H Chart: Triangle
Comment: A formation of the triangle pattern by GBP/NZD started in mid-October; the pattern has lasted for 117 hours already but is likely to be breached in the following hours as the pair almost approached the apex. Currently, GBP/NZD is vacillating slightly below the pattern’s support, suggesting that the breakout may have occurred, especially given the proximity of the apex. If it proves to be true, the Pound is likely to witness an accelerating decline against the New Zealand Dollar in the hours to come. However, market sentiment gainsays this, showing that more than 70% of traders are bullish on the pair.
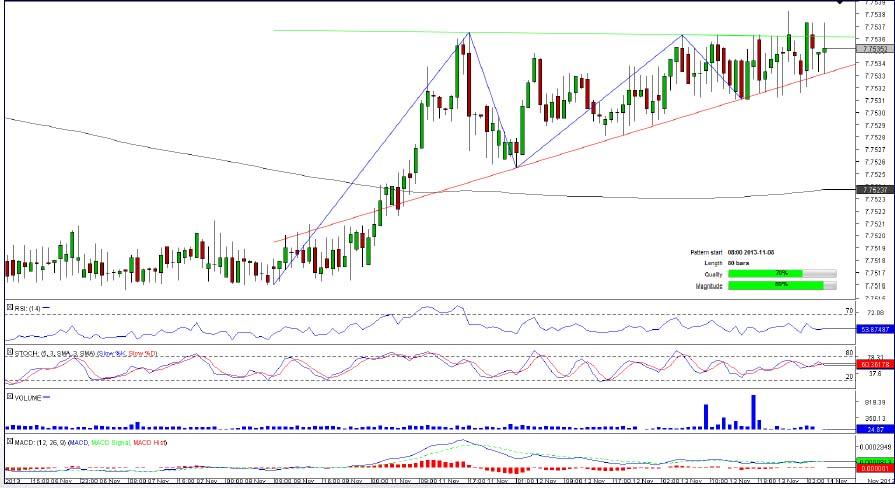
USD/HKD 4H Chart: Ascending Triangle
Comment: Having touched a one-year low, the U.S. Dollar got an impulse to advance against its Hong Kong peer. The appreciation started alongside with formation of the ascending triangle pattern on November 8. At the moment of writing, the pair was fluctuating close to the apex of the triangle that signals on the looming breakout. Ascending triangle patterns usually result in bullish breakout and this time is not likely to be an exception, with 66.67% of all orders being placed to buy the instrument. Technical indicators also suggest a climb in the short-term but are neutral for medium and long terms.
This overview can be used only for informational purposes. Dukascopy SA is not responsible for any losses arising from any investment based on any recommendation, forecast or other information herein contained.
Recommended Content
Editors’ Picks
EUR/USD edges lower toward 1.0700 post-US PCE

EUR/USD stays under modest bearish pressure but manages to hold above 1.0700 in the American session on Friday. The US Dollar (USD) gathers strength against its rivals after the stronger-than-forecast PCE inflation data, not allowing the pair to gain traction.
GBP/USD retreats to 1.2500 on renewed USD strength

GBP/USD lost its traction and turned negative on the day near 1.2500. Following the stronger-than-expected PCE inflation readings from the US, the USD stays resilient and makes it difficult for the pair to gather recovery momentum.
Gold struggles to hold above $2,350 following US inflation

Gold turned south and declined toward $2,340, erasing a large portion of its daily gains, as the USD benefited from PCE inflation data. The benchmark 10-year US yield, however, stays in negative territory and helps XAU/USD limit its losses.
Bitcoin Weekly Forecast: BTC’s next breakout could propel it to $80,000 Premium

Bitcoin’s recent price consolidation could be nearing its end as technical indicators and on-chain metrics suggest a potential upward breakout. However, this move would not be straightforward and could punish impatient investors.
Week ahead – Hawkish risk as Fed and NFP on tap, Eurozone data eyed too

Fed meets on Wednesday as US inflation stays elevated. Will Friday’s jobs report bring relief or more angst for the markets? Eurozone flash GDP and CPI numbers in focus for the Euro.


