- Litecoin price trades in an even tighter range, while buyers continue to surge.
- Ripple facing a key trading day, moving to the limits of its current formation
Litecoin's founder sends a warning about Litecoin Cash
Charlie Lee, Litecoin's founder, has called out the Litecoin Cash promoters, labeling it as 'a scam' and claiming that Litecoin doesn't have any relationship with it. Lee says this is manoeuver to get quick profits from the Litecoin brand.
We all know the importance of brands to support a certain product and the Crypto sphere is no exception. That's what makes Bitcoin a more reliable market value asset, further than its technical outlook. There's only one king.
Litecoin still with room inside the current formation, bullish outlook
LTC/USD is treading waters since last Monday, moving inside a minor triangle located inside a bigger diamond formation. Litecoin price still has room to both ways, so the resolution of this current formation doesn't look imminent.
The constant flow of rumors around Litecoin doesn't seem to have had any kind of negative effect on the LTC price, with the LitecoinCash fork not triggering any "buy the rumor, sell the fact" signal. This is a messy situation that is difficult to read considering the bleak legal framework where Cryptocurrencies move around. Anyway, the diamond figures are usually "turning" formations.
LTC/USD 4H chart
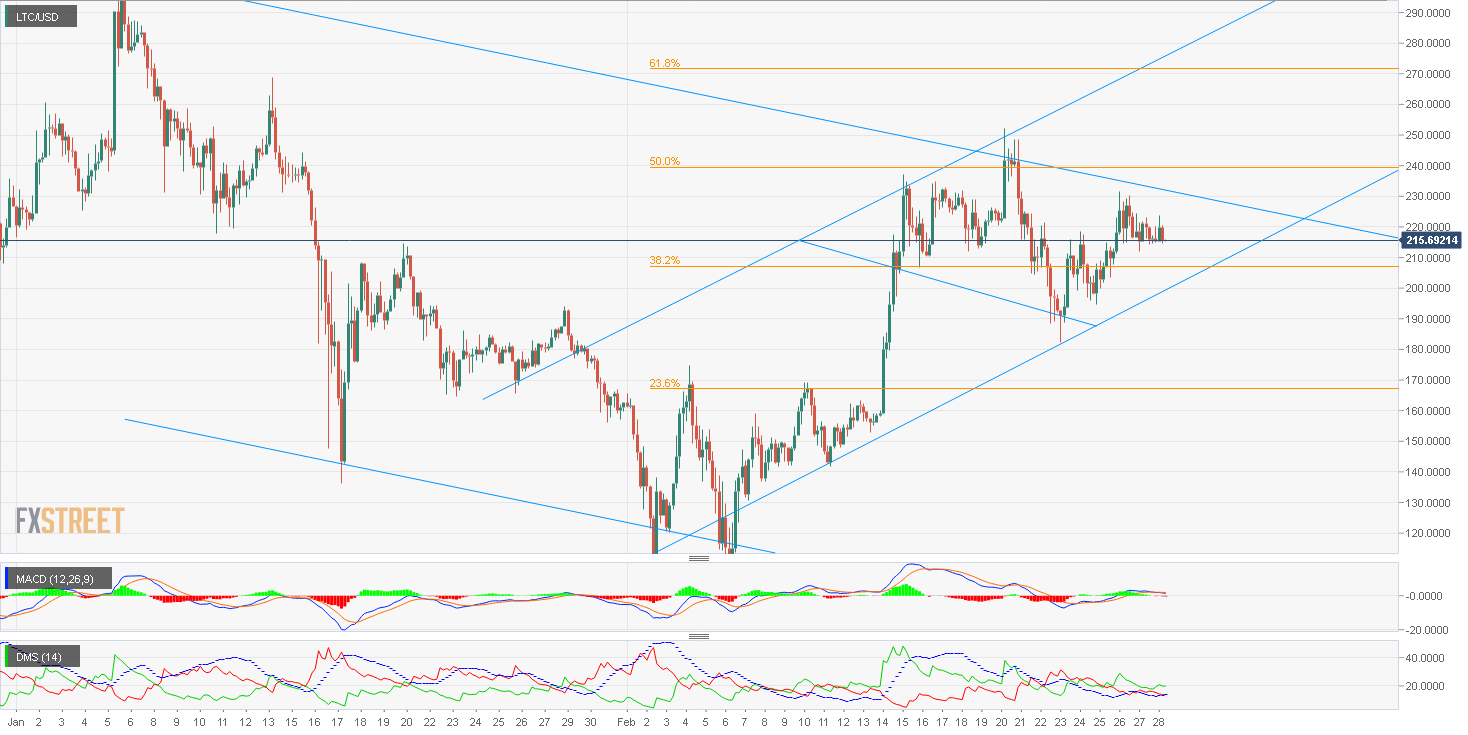
MACD in the Litecoin 4-hour chart has completely flattened and shows a certain bearish inclination, although moving just above the 0 line. That just indicates a lack of strength, so tight range lateral movements should be the most likely action in the upcoming hours.
Directional Movement Index shows a clear advantage for buyers, with sellers at really low levels. ADX is also at pretty dismal levels, strengthening the idea of quiet trading sessions ahead, with relatively tight ranges.
On the upside, Ripple finds its first resistance at $222.21, followed by $232,09. The next target, the level preventing another bullish leg, is at the 50% Fib retracement from highs, right at $239.40.
On the downside, XRP/USD has its first support at $208.82, followed by the 38.2% Fibonacci retracement from highs located at $207.12. Next target would be at the important support we can find at $200.
Ripple showing some weakness, could develop a bearish leg
XRP/USD is breaking below the triangle formation that was containing its price action. We're just at the start of the 4-hour period that we're currently charting and it should close that candle below the current level to confirm that action. This Ripple weakness does not match the generally bullish action of the Crypto board, a counter move that we should approach with caution.
XRP/USD 4H chart
 (2)-636554146654989283.png)
MACD in the Ripple 4-hour chart is about to cross down just at the 0 line. This is a clear sign of weakness which statistically usually gets sorted out with price falls.
Directional Movement Index shows sellers taking control, but with trend strength levels at pretty low levels, which might limit the range of the upcoming moves.
On the upside, Ripple should claim back $0.91 as a necessary step to go back to any kind of bullish action. If that level is breached, next targets would be at $0.95 and $0.957.
On the downside, first support has been already broken at $0.91, and if that loss is consolidated, then next one comes at $0.8906. In case Ripple price falls below there, it could quickly move back to $0.85 and $0.80.
BTC/USD 4H chart
-636554146923517729.png)
Bitcoin surprised us yesterday with an unexpected rise, clearly entering a bullish scenario and foregoing the last shoulder of a potential head&shoulders pattern. This scenario has not been fully dismantled, as the chart shows (see the dotted line). The resolution of this action shouldn't take too long, so this is one asset to track closely in the following hours.
MACD in the Bitcoin 4-hour chart is looking very positive despite being very close to the 0 line. A good separation between the average and the signal gives some room to the bullish action, although a testing movement from the 0 line to the upside is not out of the cards.
Directional Movement Index is still favorable to the buyers, although sellers have appeared in the last 8 hours. Trend is not strengthening, as we can see in a pretty flat ADX.
On the upside, first resistance is at $11530, followed by $11690 and at last the $12890-$13000 levels, the roof of the bullish channel that rules the price action since lows.
On the downside, there are important support levels to break if BTC/USD wants to complete the head&shoulders pattern. First support is at $10339, followed immediately by $10324 and $10196. If those levels get lost, first important support is at $9350 and the last target of the figure would be at $8595.
Information on these pages contains forward-looking statements that involve risks and uncertainties. Markets and instruments profiled on this page are for informational purposes only and should not in any way come across as a recommendation to buy or sell in these assets. You should do your own thorough research before making any investment decisions. FXStreet does not in any way guarantee that this information is free from mistakes, errors, or material misstatements. It also does not guarantee that this information is of a timely nature. Investing in Open Markets involves a great deal of risk, including the loss of all or a portion of your investment, as well as emotional distress. All risks, losses and costs associated with investing, including total loss of principal, are your responsibility. The views and opinions expressed in this article are those of the authors and do not necessarily reflect the official policy or position of FXStreet nor its advertisers. The author will not be held responsible for information that is found at the end of links posted on this page.
If not otherwise explicitly mentioned in the body of the article, at the time of writing, the author has no position in any stock mentioned in this article and no business relationship with any company mentioned. The author has not received compensation for writing this article, other than from FXStreet.
FXStreet and the author do not provide personalized recommendations. The author makes no representations as to the accuracy, completeness, or suitability of this information. FXStreet and the author will not be liable for any errors, omissions or any losses, injuries or damages arising from this information and its display or use. Errors and omissions excepted.
The author and FXStreet are not registered investment advisors and nothing in this article is intended to be investment advice.
Recommended Content
Editors’ Picks
EUR/USD edges lower toward 1.0700 post-US PCE

EUR/USD stays under modest bearish pressure but manages to hold above 1.0700 in the American session on Friday. The US Dollar (USD) gathers strength against its rivals after the stronger-than-forecast PCE inflation data, not allowing the pair to gain traction.
GBP/USD retreats to 1.2500 on renewed USD strength

GBP/USD lost its traction and turned negative on the day near 1.2500. Following the stronger-than-expected PCE inflation readings from the US, the USD stays resilient and makes it difficult for the pair to gather recovery momentum.
Gold struggles to hold above $2,350 following US inflation

Gold turned south and declined toward $2,340, erasing a large portion of its daily gains, as the USD benefited from PCE inflation data. The benchmark 10-year US yield, however, stays in negative territory and helps XAU/USD limit its losses.
Bitcoin Weekly Forecast: BTC’s next breakout could propel it to $80,000 Premium

Bitcoin’s recent price consolidation could be nearing its end as technical indicators and on-chain metrics suggest a potential upward breakout. However, this move would not be straightforward and could punish impatient investors.
Week ahead – Hawkish risk as Fed and NFP on tap, Eurozone data eyed too

Fed meets on Wednesday as US inflation stays elevated. Will Friday’s jobs report bring relief or more angst for the markets? Eurozone flash GDP and CPI numbers in focus for the Euro.