Jack Steiman, On Awaiting One Last Bull Rally (SwingTradeOnline.com)
The market swings about quite bit in a given day, but in the end, day after day, a "handle" is apparent on those index daily charts, not to mention the charts of many leading stocks. Some areas of the market are working well and others not so well, but, overall, the indexes are doing what one would expect off the large up move that came about from the resolution of the fiscal cliff. These handles don't have any specific time frame to which they stay lateral. It can be days or weeks, but usually weeks is the answer off of such a large move higher, such as we saw. It was fast and very sharp.
A lot of energy and fuel was used up in that move, so lateral is healthy. The handle is nearly two weeks old, so the odds are increasing that it should go soon. A drop of good economic news may do the trick.
The President spoke today about how the economy is doing and what needs to be done about the approaching debt ceiling. He spoke forcefully about how we must not let the debt ceiling come and go without a real resolution, lest we head into a recession. He also warned that there will be a market move quite a bit lower should things not get taken care of now. He tried very hard to put the onus on the Republicans, and talked about not really wanting to bargain. That was a bit interesting, if not strange, since even a reporter said it wasn't wise to threaten and not talk. It doesn't sound good, as the sides are about to get nasty with each other.
Obama fired the first shot today, which means you'll be hearing rebuttal very soon, to be sure. If this gets ugly as the deadline approaches, it won't be good for the market. It's easy to say that's a fact of life, but really folks, with sentiment starting to get stretched, the market doesn't need a battle here between the two sides. They need to work together, and now, but who knows what they'll do.
For the moment, the daily index charts look quite favorable with, I believe, one last move higher to go before the market likely tops out for several months. One more move up will take sentiment to levels that are unsustainable. Add in one more move up taking all the daily index charts to 70+ RSI's. Add one more factor, such as the debt ceiling approaching at the end of February, and it tells me one more move is left, if, and when, we clear S&P 500 1470 with force.
I think it will happen and take us into the low 1500's, but that should be it for quite a while with regards to sustainable upside action. Keeping long-side exposure makes sense, but getting too involved here makes little sense. Even if we do break above 1470 with force, being I think this is the last move up for a while, it's best to keep it within reason. 1440 remains strong support. Add in Apple Inc. (AAPL) looking like it wants 475/480. But we shall see.
Avoid the weak and play the strong for this last rally. The bull market is likely not over, but a long pause will be needed soon.
Mike Paulenoff, On Bears Missing Opportunity (MPTrader.com)
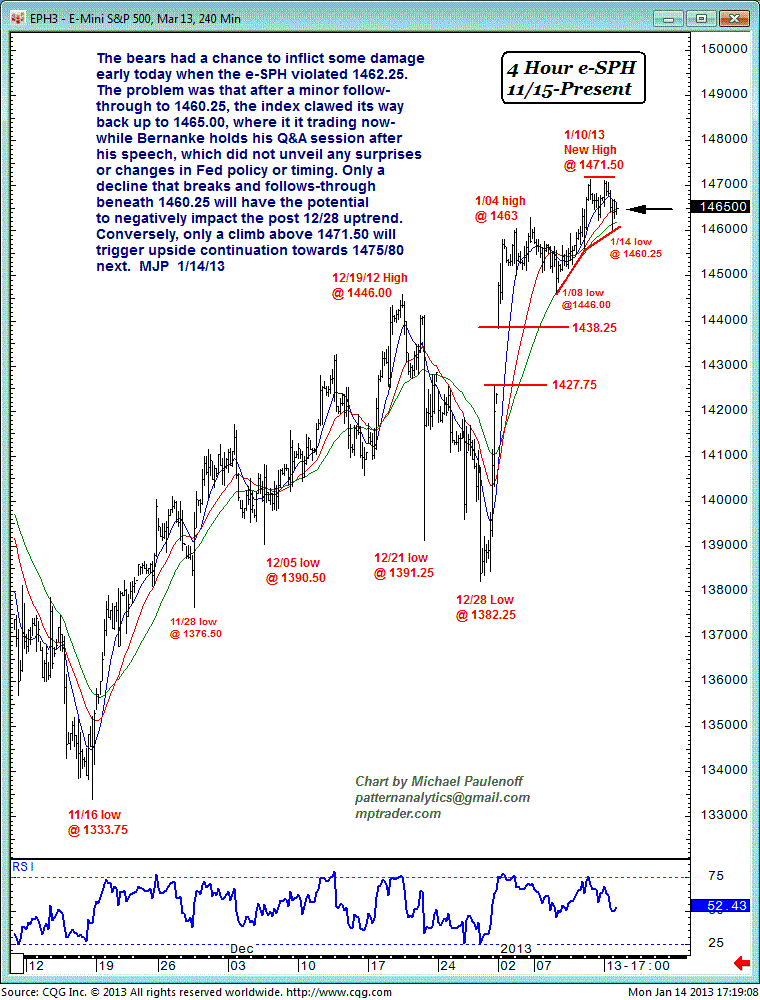
The bears had a chance to inflict some damage early Monday when the Emini S&P 500 violated 1462.25. The problem was that after a minor follow-through to 1460.25, the index clawed its way back up to 1465.00.
This is where it was trading as Bernanke held his Q&A after his speech, which did not unveil any surprises or changes in Fed policy or timing.
Only a decline that breaks and follows through beneath 1460.25 will have the potential to negatively impact the post December 28 uptrend. Conversely, only a climb above 1471.50 will trigger upside continuation towards 1475/80 next.
Avi Gilburt, On Impulsive Count Over 1500 Still Alive (ElliottWaveTrader.net)
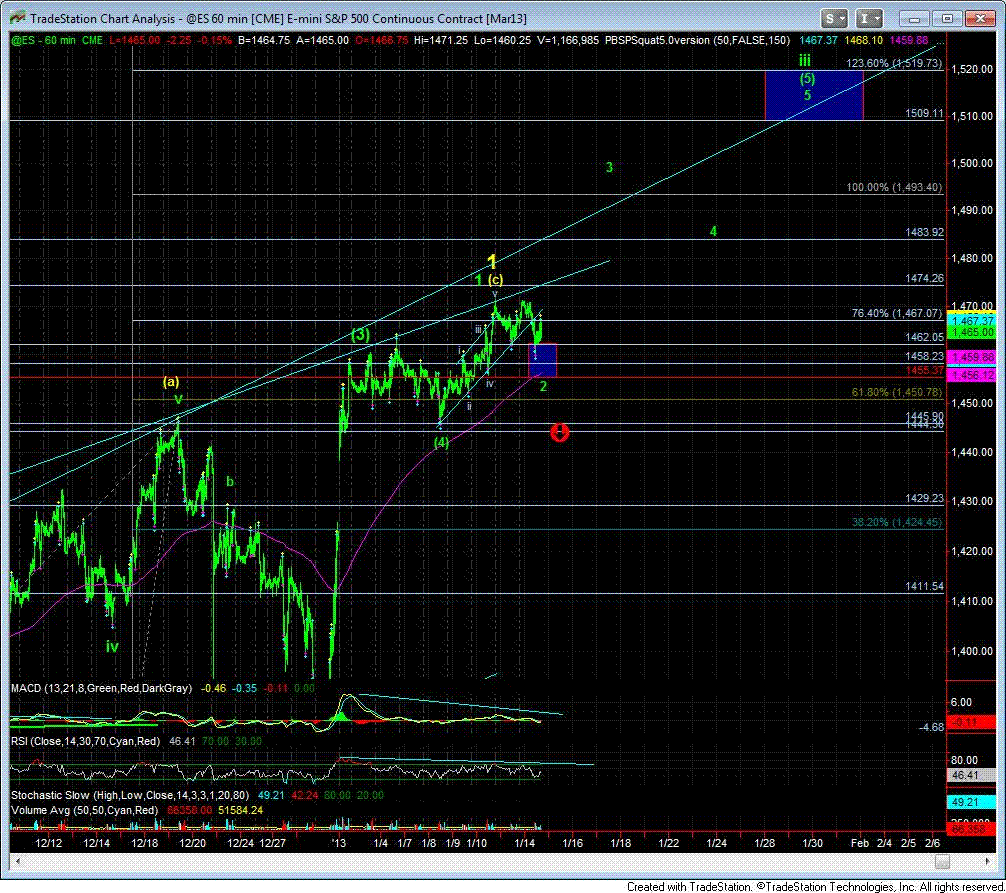
Today we confirmed the completion of the diagonal from last week at the 1471ES high. The question at hand is if that digaonal completed all of the yellow wave 1 in a much larger ending diagonal, which means that we are going to be headed down into the end of the month in a larger wave 2 retracement, or if that was only wave 1 in wave (5) of wave iii of wave 3.
At this point, the jury is still out on that question. We are looking for the market to maintain support over 1456ES to keep us confidently looking up and over 1500 in short order. But, 1456ES really must hold, and if it does not, then the ultimate answer rests in whether 1445ES holds as support. Any break down below 1445ES puts us in a relatively clear larger diagonal pattern, with the potential to head back down towards the 1400 region in a wave 2, with the last top marked with a yellow 1 as wave 1 of a larger ending diagonal.
But, if we can break out over 1468ES, and then take out 1472ES, my target for wave 3 (based upon today's low) is 1495-1501ES. Ultimately, this pattern has its 2.00 extension up at 1511ES with the higher extension right at our larger 1.236 extension at 1520ES.
So, a lot rests on what happens tomorrow. If we get another decline but still hold 1456ES, then we should still head up to the higher target, although I will have to modify them slightly lower. But, if the market is going to break down below 1456ES, then that is the first shot across the bow, and would have me a bit more cautious about the bullish implications of this green 1-2 set up.
Harry Boxer, On Four Charts to Watch (TheTechTrader.com)
There was some sloppy action and the stock market ended mixed on Monday. Many of the stocks we follow are still doing well. We were going to go over the short side, but decided not just yet. Instead, we'll take a look at some of the longs we have been following and swing trades that we put out.
Arena Pharmaceuticals, Inc. (ARNA) has a nice base and a long pattern that goes back to July. It ran up May, June, July, which took it from 2.25 to 14, almost seven-fold in just a couple months. Then it resulted in a big consolidation, freebased, and now it's up against resistance near the 10.35 range, reaching as high as 10.31 on Monday, and closing at 10.20, up 54 cents, or 5.59%, on 20 million shares. That's the second biggest volume in a couple months. If it does follow through on Tuesday, we could see this stock run quickly to 12, the short-term target, and then to the secondary target at 14.
Celsion Corp. (CLSN) has been acting great. We put another swing trade out on it on Monday. There was a wonderful trade during most of November that went from the 4.00-range up to 8.50 or so. It consolidated in a wedge the last few weeks, and may have popped out of it on 2.9 million shares on Monday. That's the biggest volume in two or three weeks. It closed at 27.22, up 2.39, or 9.6%, and looks like it may run up to test the 10 3/4 zone, which is the near-term target.
Halozyme Therapeutics, Inc. (HALO) had the declining topsline and lateral price resistance taken out as well as the flag that was in that same area. It popped, pulled back for a couple days, and then exploded on Monday, up 1.12 to 8.34, or nearly 16%, on 3 million shares. That's the second biggest volume since September. At this point, if it can get across the line where it closed on Monday, then it should be able to get up around 10-10.25.
TearLab Corporation (TEAR) was put out as a swing trade, and it popped through resistance, pulled back to retest that zone, and then it bounced, up 13 cents to 5.44, or 2.45%, on nearly a half million shares. That was the best volume in the last three or four sessions. It looks like it can extend. The long-term chart shows some big upside in the 10 zone, which means it will have doubled if it makes that move up.
Other stocks on Harry's Charts of the Day are ACADIA Pharmaceuticals Inc. (ACAD), Amyris, Inc. (AMRS), Acme Packet, Inc. (APKT), BIOLASE, Inc. (BIOL), Flowers Foods, Inc. (FLO), Krispy Kreme Doughnuts, Inc. (KKD), Opko Health, Inc. (OPK), Perion Network Ltd (PERI), Research In Motion Limited (RIMM), Sangamo Biosciences Inc. (SGMO), and TrovaGene, Inc. (TROV).
This Web site is published by AdviceTrade, Inc. AdviceTrade is a publisher and not registered as a securities broker-dealer or investment advisor either with the U.S. Securities and Exchange Commission or with any state securities authority. The information on this site has been obtained from sources considered reliable but we neither guarantee nor represent the completeness or accuracy of the information. In addition, this information and the opinions expressed are subject to change without notice. Neither AdviceTrade nor its principals own shares of, or have received compensation by, any company covered or any fund that appears on this site. The information on this site should not be relied upon for purposes of transacting securities or other investments, nor should it be construed as an offer or solicitation of an offer to sell or buy any security. AdviceTrade does not assess, verify or guarantee the suitability or profitability of any particular investment. You bear responsibility for your own investment research and decisions and should seek the advice of a qualified securities professional before making any investment.
Recommended Content
Editors’ Picks
EUR/USD edges lower toward 1.0700 post-US PCE

EUR/USD stays under modest bearish pressure but manages to hold above 1.0700 in the American session on Friday. The US Dollar (USD) gathers strength against its rivals after the stronger-than-forecast PCE inflation data, not allowing the pair to gain traction.
GBP/USD retreats to 1.2500 on renewed USD strength

GBP/USD lost its traction and turned negative on the day near 1.2500. Following the stronger-than-expected PCE inflation readings from the US, the USD stays resilient and makes it difficult for the pair to gather recovery momentum.
Gold struggles to hold above $2,350 following US inflation

Gold turned south and declined toward $2,340, erasing a large portion of its daily gains, as the USD benefited from PCE inflation data. The benchmark 10-year US yield, however, stays in negative territory and helps XAU/USD limit its losses.
Bitcoin Weekly Forecast: BTC’s next breakout could propel it to $80,000 Premium

Bitcoin’s recent price consolidation could be nearing its end as technical indicators and on-chain metrics suggest a potential upward breakout. However, this move would not be straightforward and could punish impatient investors.
Week ahead – Hawkish risk as Fed and NFP on tap, Eurozone data eyed too

Fed meets on Wednesday as US inflation stays elevated. Will Friday’s jobs report bring relief or more angst for the markets? Eurozone flash GDP and CPI numbers in focus for the Euro.

