EUR/USD
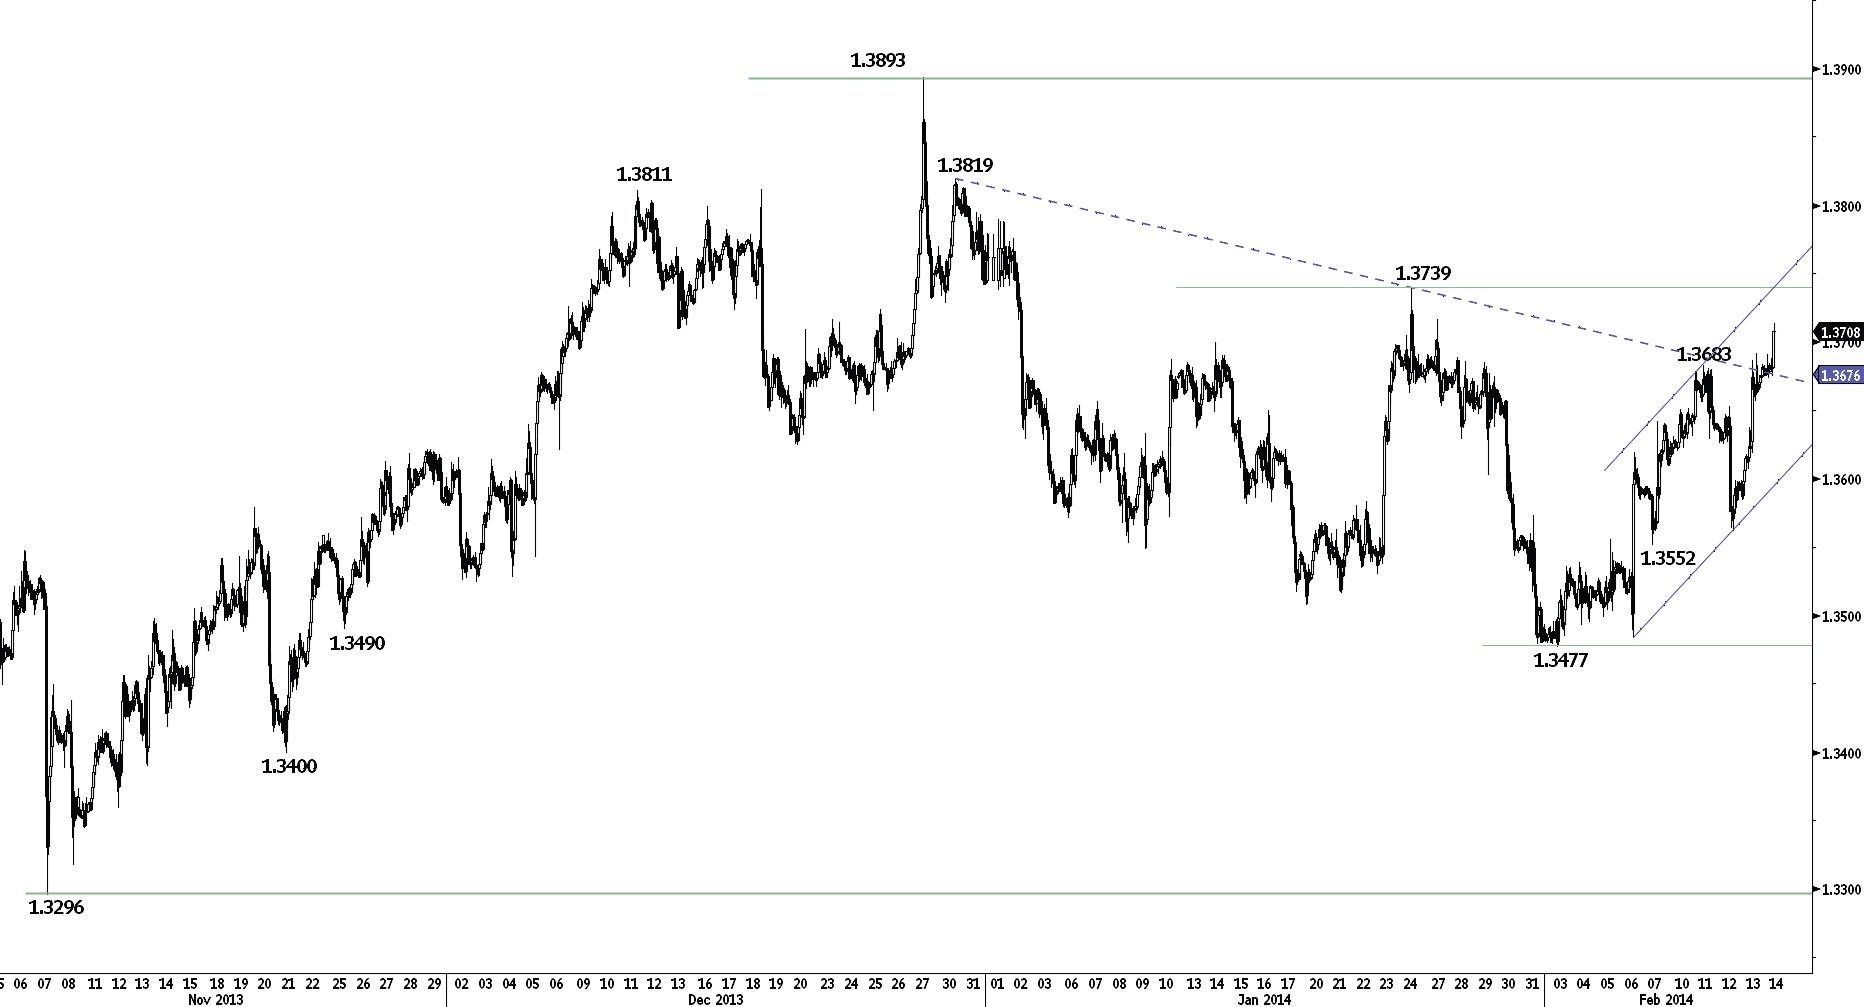
Rising towards the resistance at 1.3739.
EUR/USD rose sharply yesterday and has succeeded in making higher highs. Monitor the key resistance at 1.3739. Hourly supports are given by 1.3657 (intraday low) and the short-term rising channel (around 1.3595). Another resistance can be found at 1.3819.
Monitor the medium-term horizontal range between the support at 1.3477 and the resistance at 1.3739.
In the longer term, we favour a broad horizontal range between 1.3296 (07/11/2014 low) and 1.3893 (27/12/2013 high). A first key support is given by the 200 day moving average (around 1.3400).
Await fresh signal.
GBP/USD
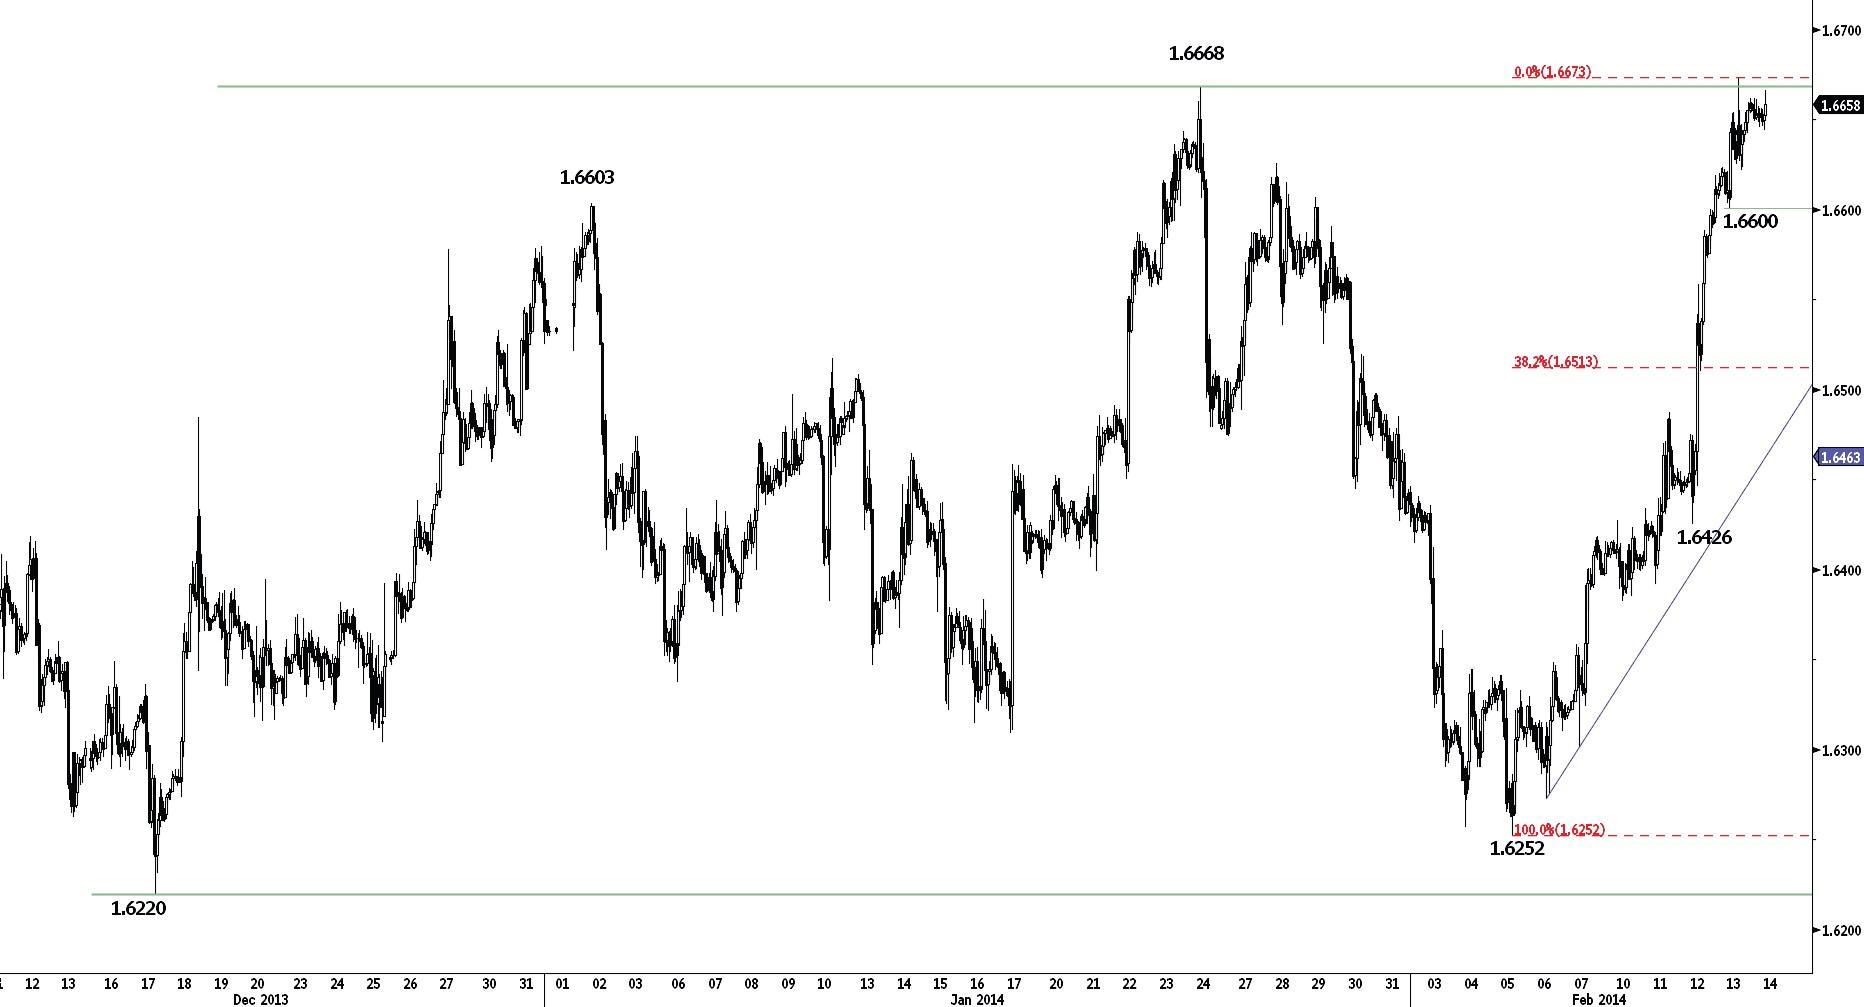
Challenging the key resistance at 1.6668.
GBP/USD continues its streak of strong daily advances. The key resistance at 1.6668 is challenged. Another resistance can be found at 1.6747. The short-term technical structure remains positive as long as the support at 1.6600 holds. Another support can be found at 1.6511 (intraday low).
In the longer term, the technical structure favours a bullish bias as long as the support at 1.6220 holds. A decisive break of the resistance at 1.6668 would open the way for a move towards the major resistance at 1.7043 (05/08/2009 high).
Await fresh signal.
USD/JPY
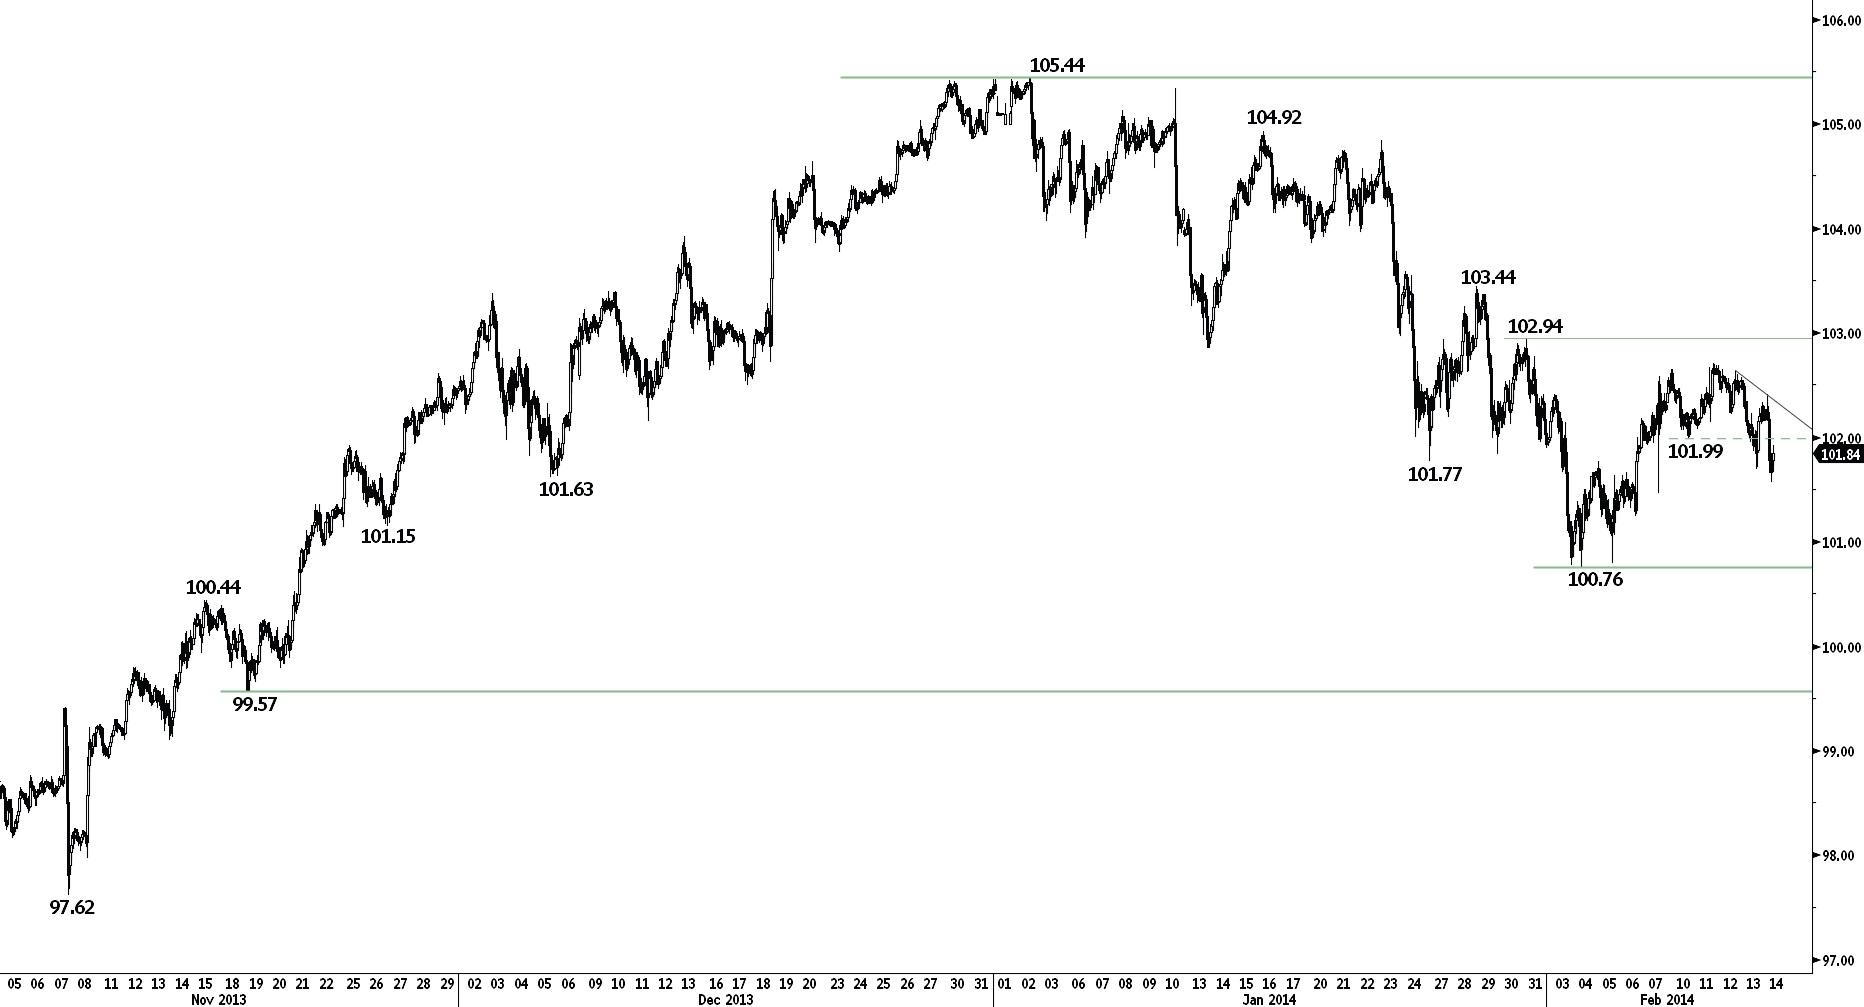
Weakening.
USD/JPY has broken the hourly support at 101.99, opening the way for a further decline towards the support at 100.76. A first support can be found at 101.25 (06/02/2014 low). Hourly resistances now stand at 102.41 (intraday high) and 102.70 (11/02/2014 high).
A long-term bullish bias is favoured as long as the key support area given by the 200 day moving average (around 100.21) and 99.57 (see also the rising trendline from the 93.79 low (13/06/2013)) holds. A major resistance stands at 110.66 (15/08/2008 high).
Await fresh signal.
USD/CHF
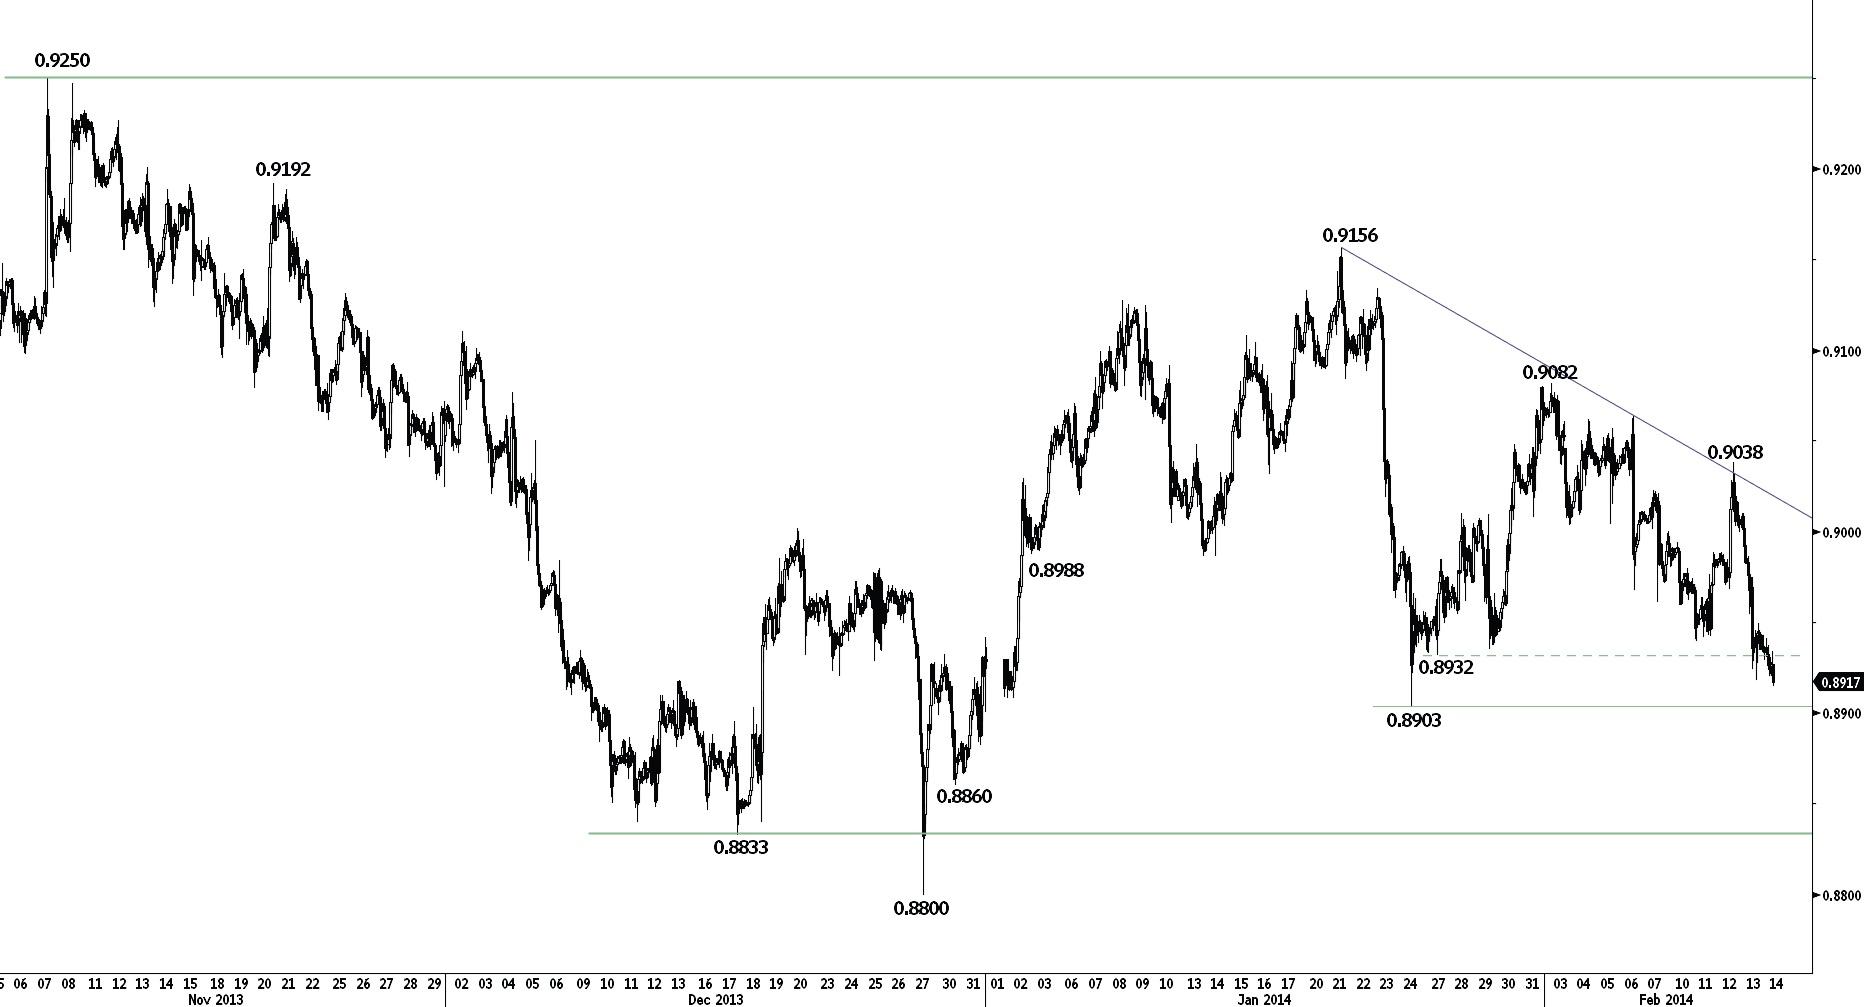
Monitor the test of the support at 0.8903.
USD/CHF continues to decline and is now challenging the support at 0.8903. A break of this support would call for a new test of the key support at 0.8833. Hourly resistances lie at 0.8949 (intraday high) and 0.9038 (see also the declining trendline).
From a longer term perspective, the structure present since 0.9972 (24/07/2012) is seen as a large corrective phase which has potentially reached completion. The support area defined by 0.8931 (24/02/2012 low) and 0.8833 favours a potential medium-term base formation. A key resistance stands at 0.9250.
Await fresh signal.
USD/CAD
Grinding lower.
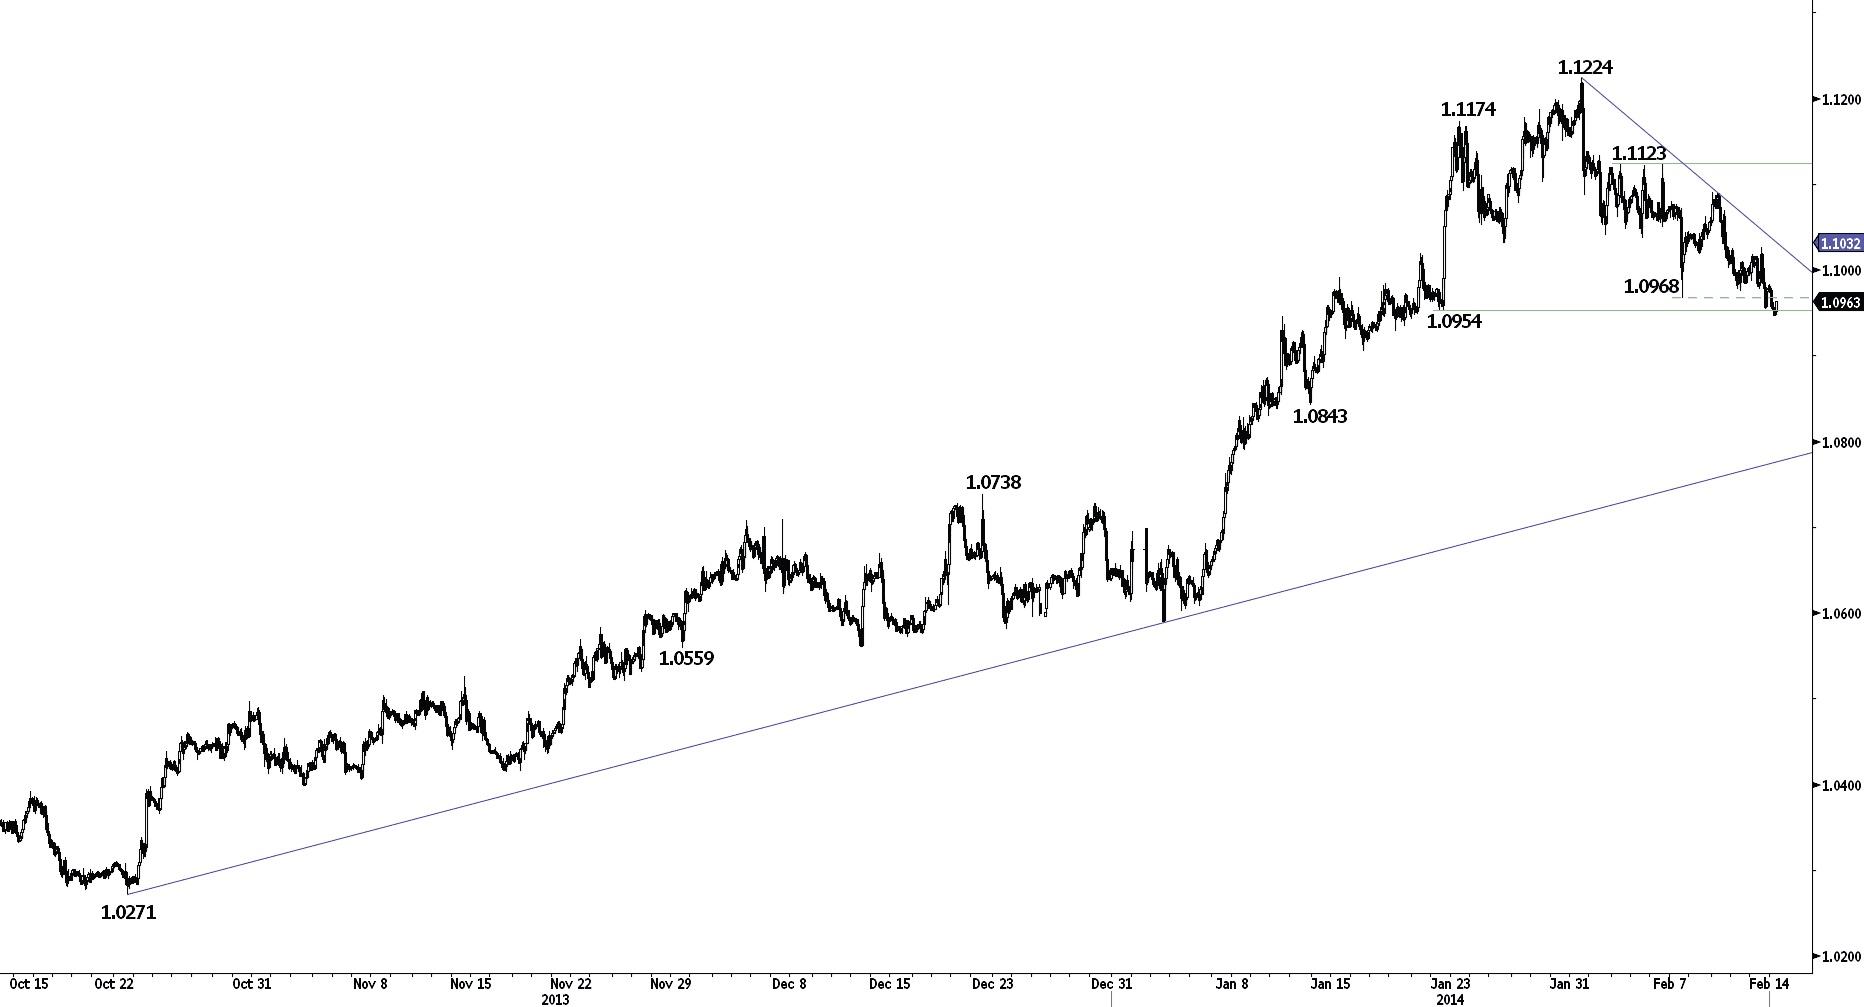
USD/CAD has broken its recent low at 1.0968 and is challenging the one at 1.0954. Another support lies at 1.0843. A break of the hourly resistance at 1.1026 (13/02/2014 high, see also the declining trendline) is needed to negate the short-term bearish trend. Another resistance can be found at 1.1091 (11/02/2014 high).
In the longer term, the decisive break of the major resistance at 1.0870 validates a multi-year basing formation whose minimum upside potential is around 1.1910. A first resistance is given by the 50% retracement of the decline from the September 2009 peak at 1.3065 (around 1.1236).
Await fresh signal.
AUD/USD
Retracing its recent decline.
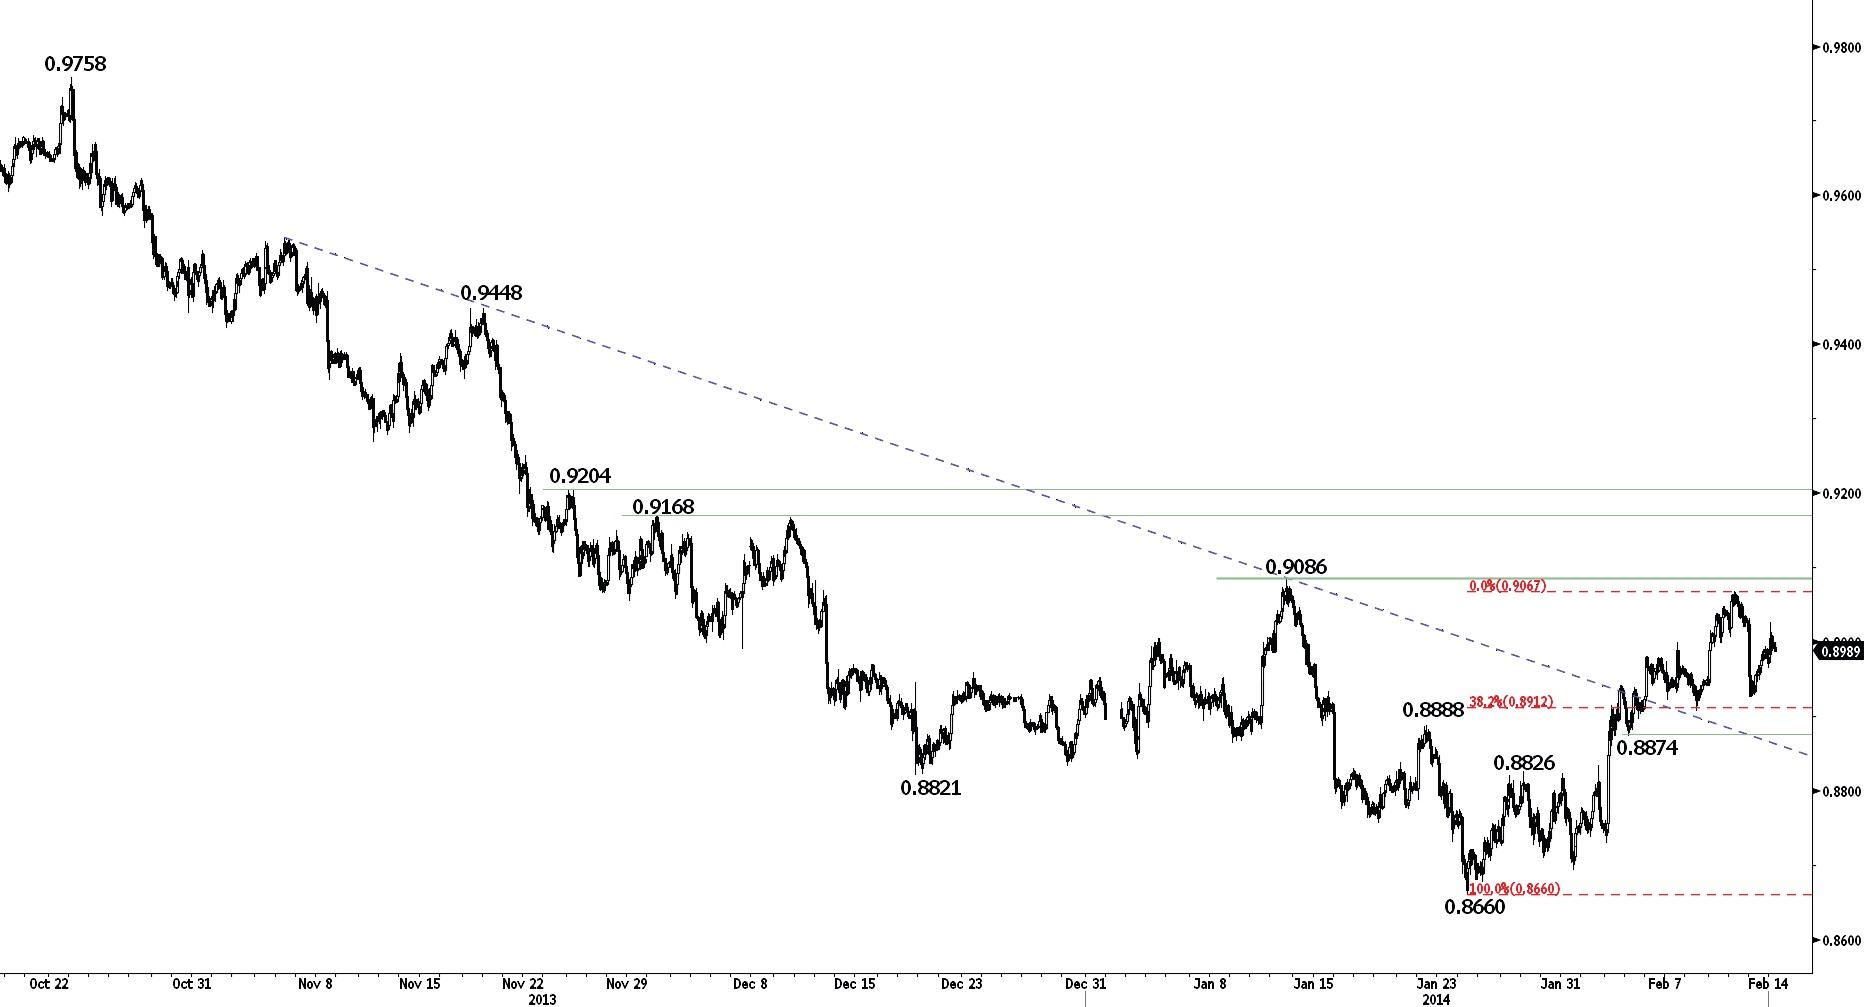
AUD/USD has almost completely retraced its yesterday's decline, suggesting persistent shortterm buying interest. Monitor the key resistance at 0.9086. Hourly supports stand at 0.8907 (10/02/201 low) and 0.8874 (05/02/2014 low).
The long-term technical pattern is negative and favours a further decline towards the key support at 0.8067 (25/05/2010 low), as long as prices remain below the resistance at 0.9168 (02/12/2013 high, see also the 200 day moving average).
Await fresh signal.
GBP/JPY
Pausing within its advance.
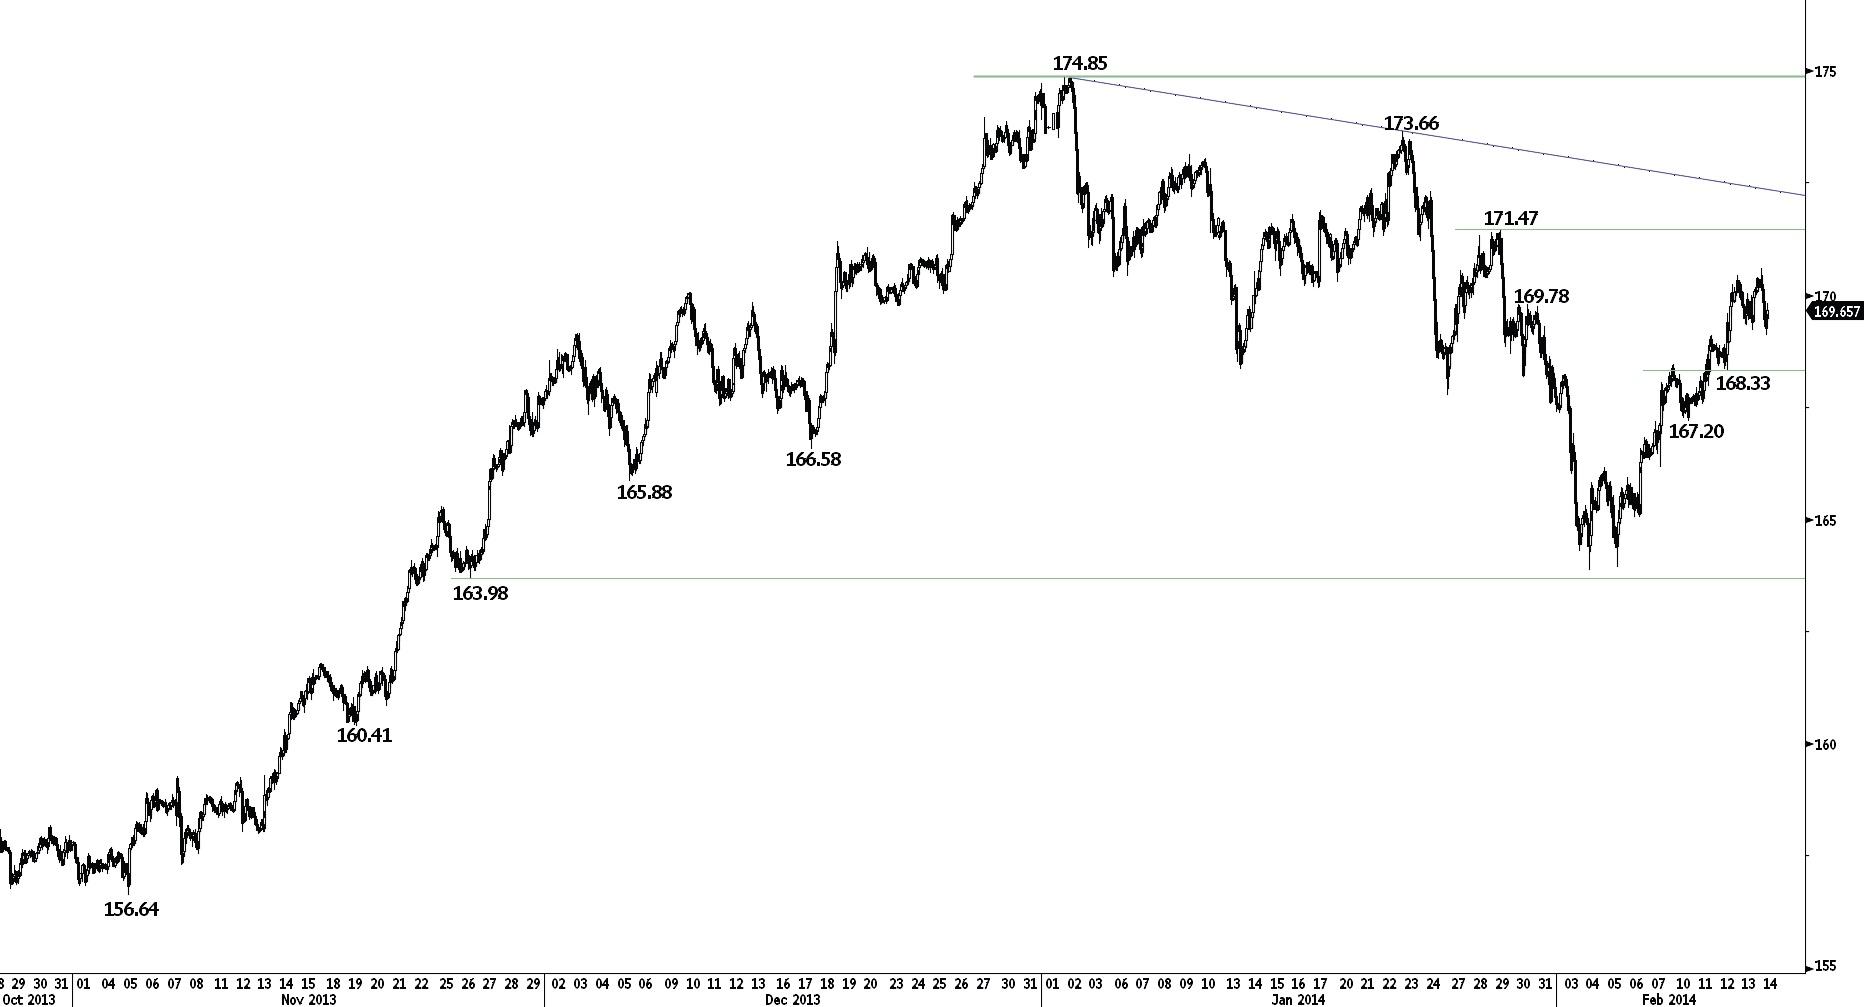
GBP/JPY's short-term technical structure remains positive as long as the initial support at 168.33 (10/02/2014 low) holds. Another support can be found at 167.20. Hourly resistances stand at 171.47 and 173.66.
The break of the major resistance at 163.09 calls for further long-term strength towards the resistance at 179.17 (15/08/2002 low). The longterm technical structure remains supportive as long as the key low at 154.73 (09/10/2013 low) holds.
Await fresh signal.
EUR/JPY
Symmetrical triangle favours a shortterm bullish bias.
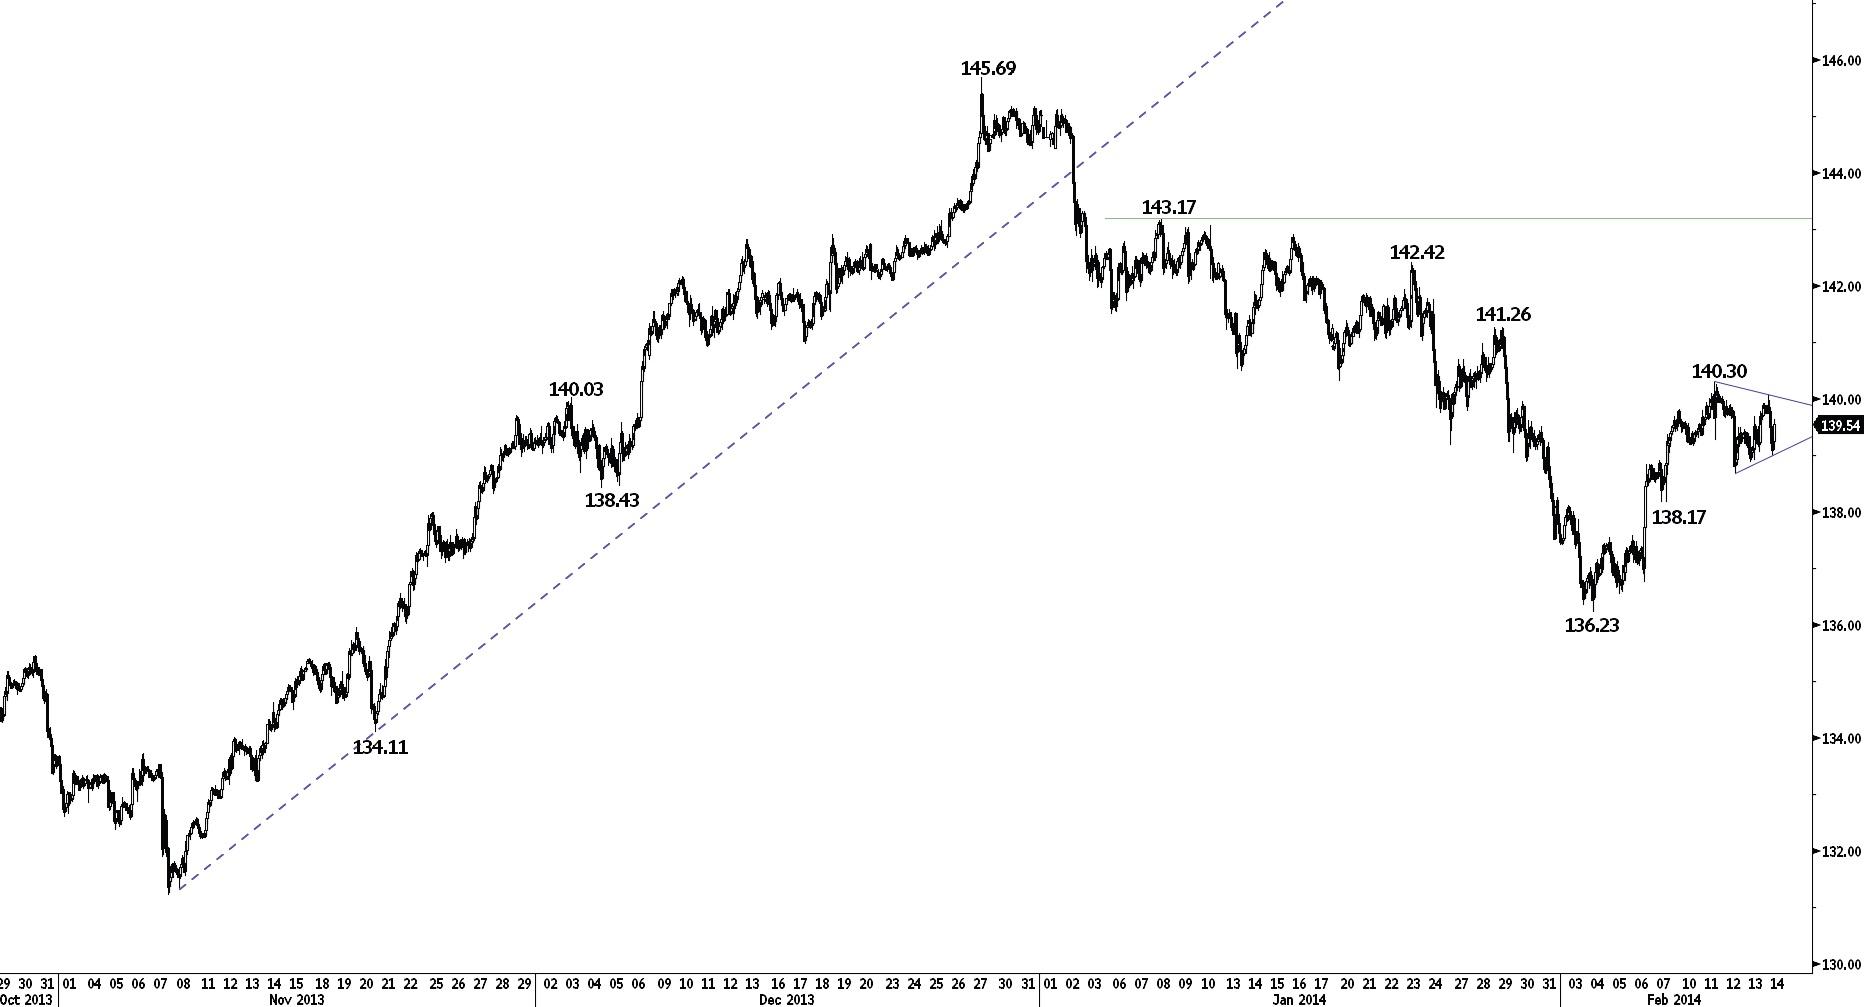
EUR/JPY's recent consolidation looks like a symmetrical triangle, favouring a continuation of the recent rise. Hourly supports stand at 138.68 (12/02/2014 high) and 138.17. Horizontal resistances stand at 140.30 and 141.26.
The long-term technical structure remains positive as long as the support at 131.15 (08/10/2013 low) holds, despite the break of the key support at 138.43 (04/12/2013 low). Another key support lies at 134.11 (20/11/2013 low, see also the 200 day moving average). A resistance lies at 147.04 (16/09/2008 low).
Await fresh signal.
EUR/GBP
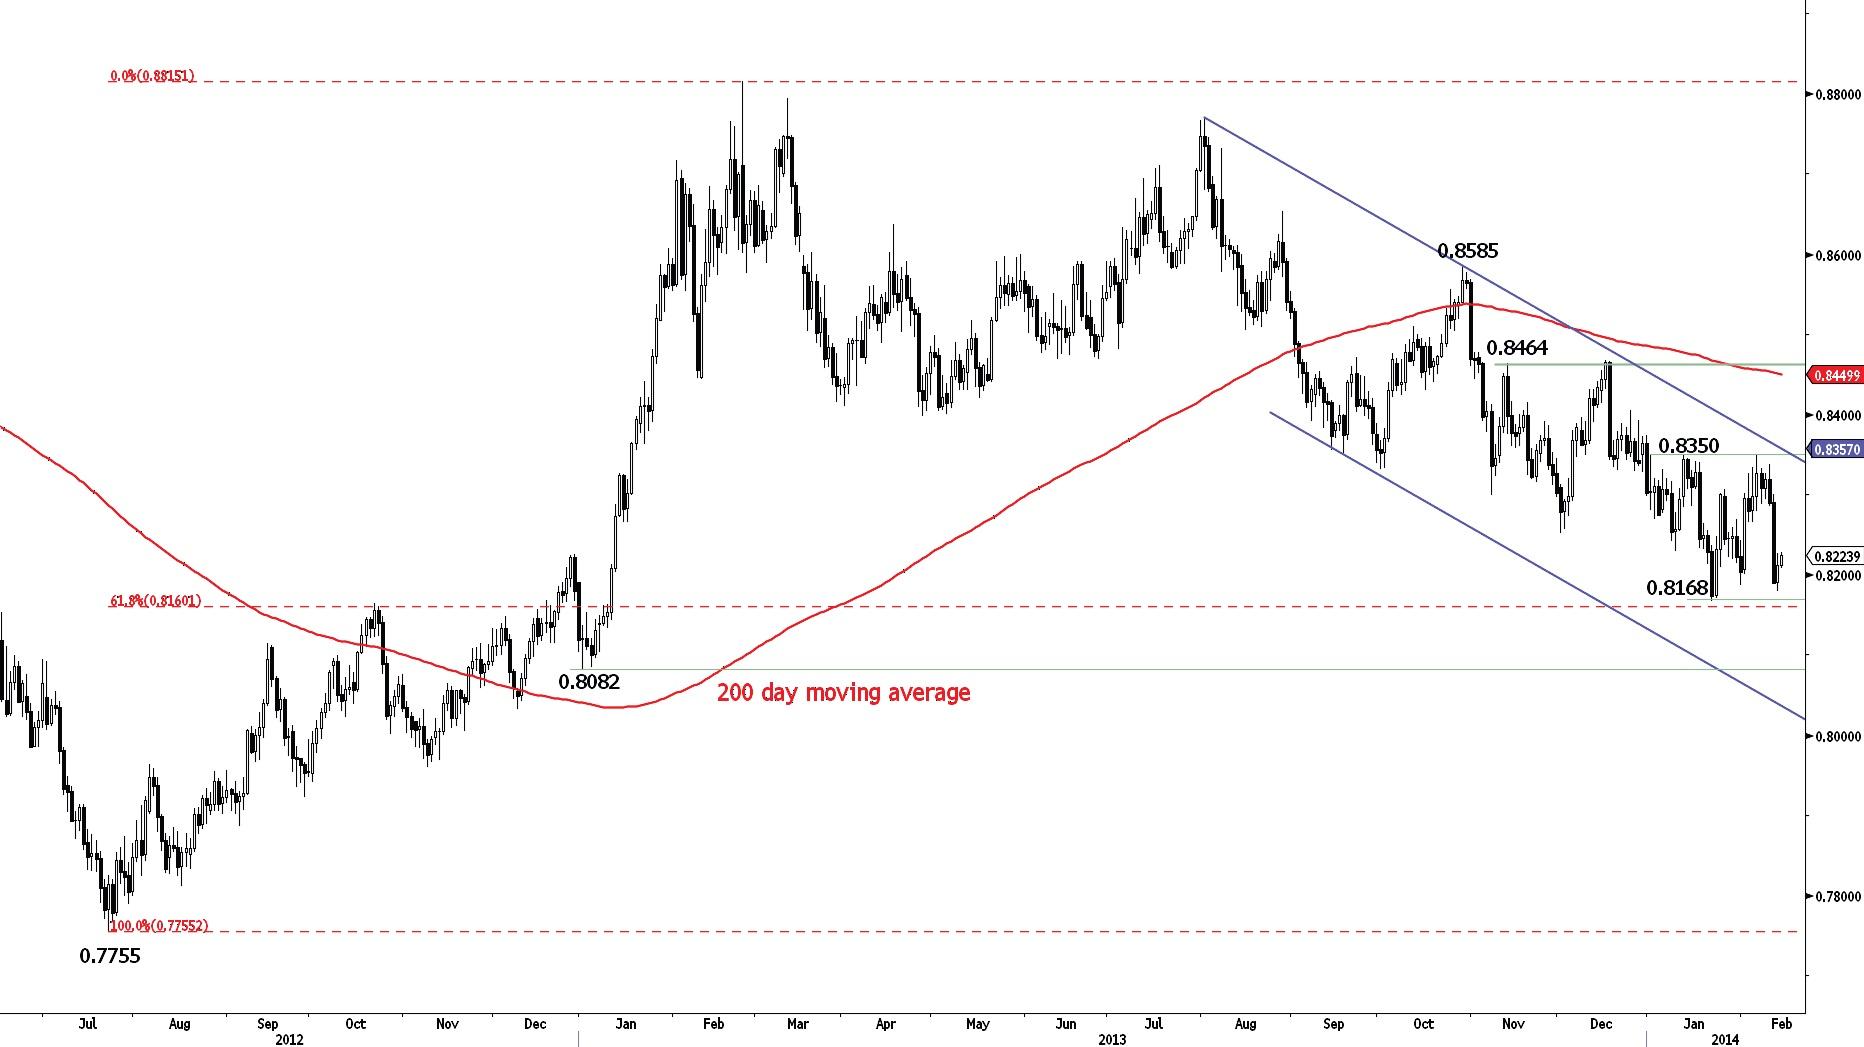
Sliding back to its lows at 0.8168.
EUR/GBP has sharply declined. Prices are now close to the key support at 0.8168. A break of the hourly resistance at 0.8249 (intraday low) is needed to suggest something more than a dead cat bounce.
In the longer term, the technical structure remains negative as long as prices remain below the resistance at 0.8350 (13/01/2014 high). Monitor the support implied by the 61.8% retracement (of the 2012-2013 rise) at 0.8160. Another key support can be found at 0.8082 (01/01/2013 low).
Await fresh signal.
EUR/CHF
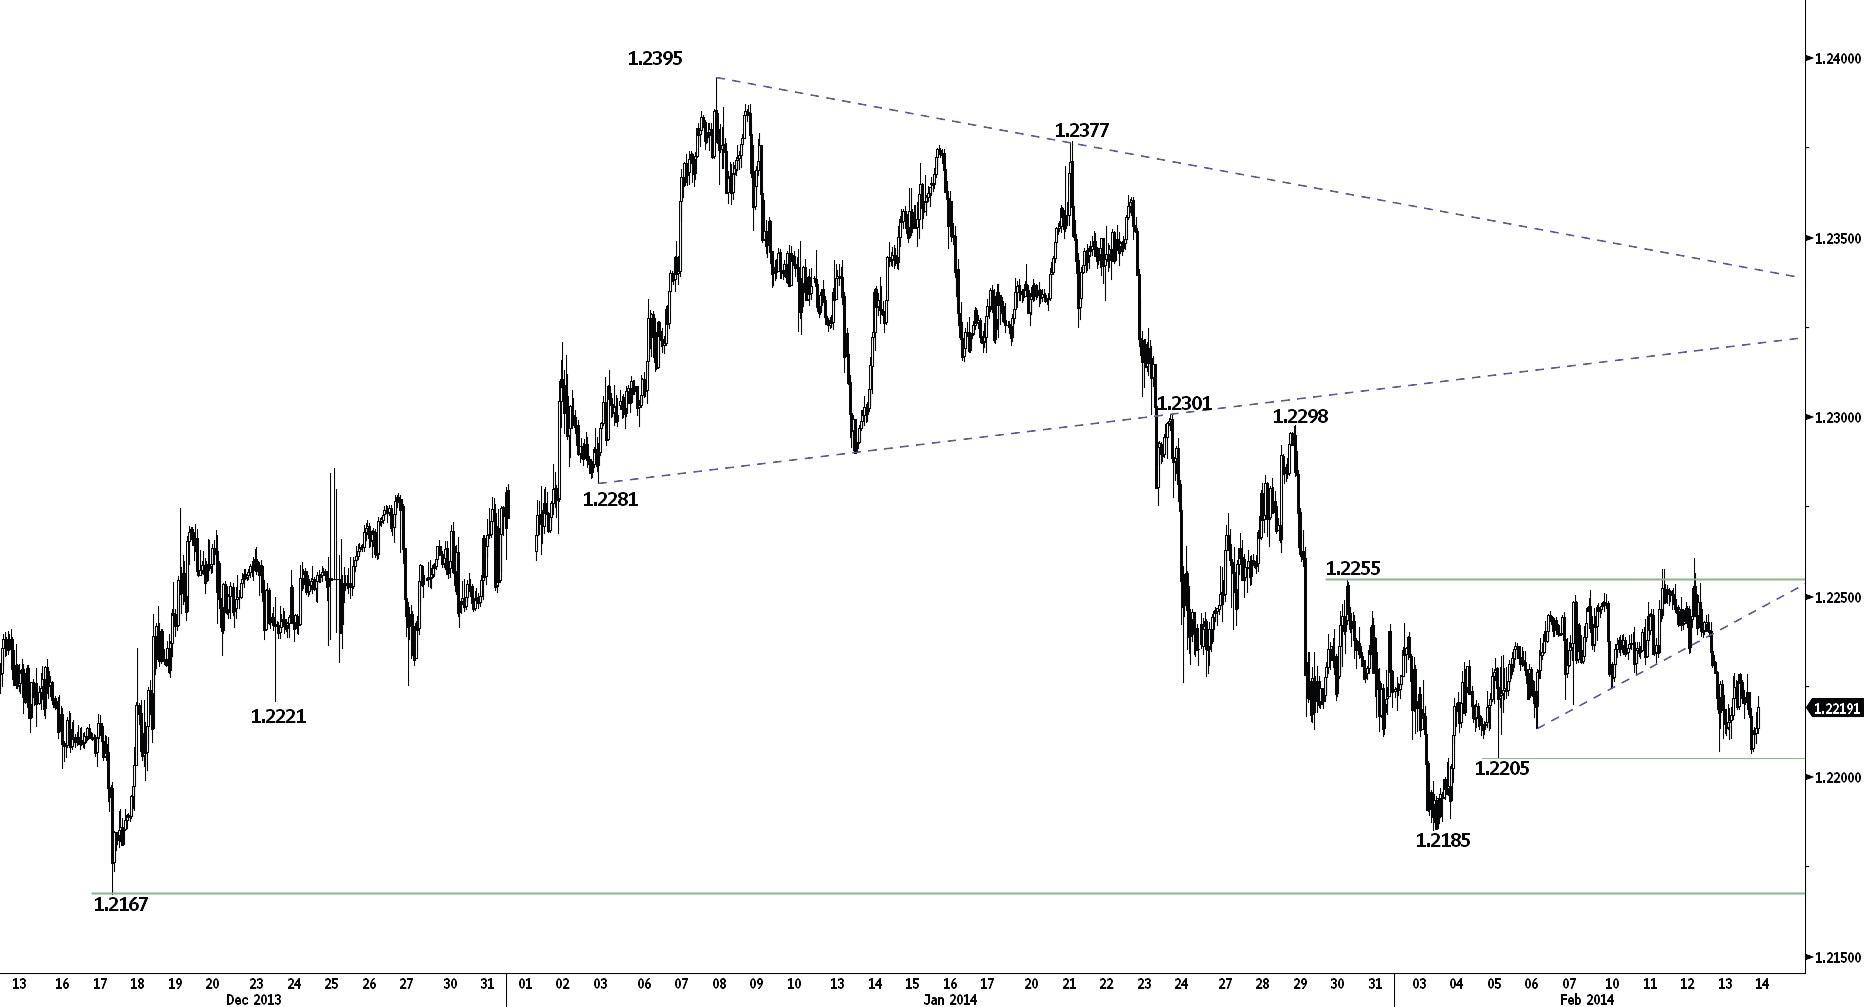
Trying to bounce near the support at 1.2205.
EUR/CHF has thus far successfully tested the hourly support at 1.2205 (05/02/2014 low). A break of the initial resistance at 1.2229 (intraday high) would validate a short-term doublebottom. A key resistance stands at 1.2255. Another support can be found at 1.2185 (03/02/2014 low).
In September 2011, the SNB put a floor at 1.2000 in EUR/CHF, which is expected to hold in the medium-term. We generally favour further longer term upside for EUR/CHF towards the psychological threshold at 1.3000. A key support lies at 1.2120 (26/02/2013 low).
Long 3 units at 1.2329, Objs: 1.2660/1.2985/1.3195, Stop: 1.1998 (Entered: 2013-01-23).
GOLD (in USD)
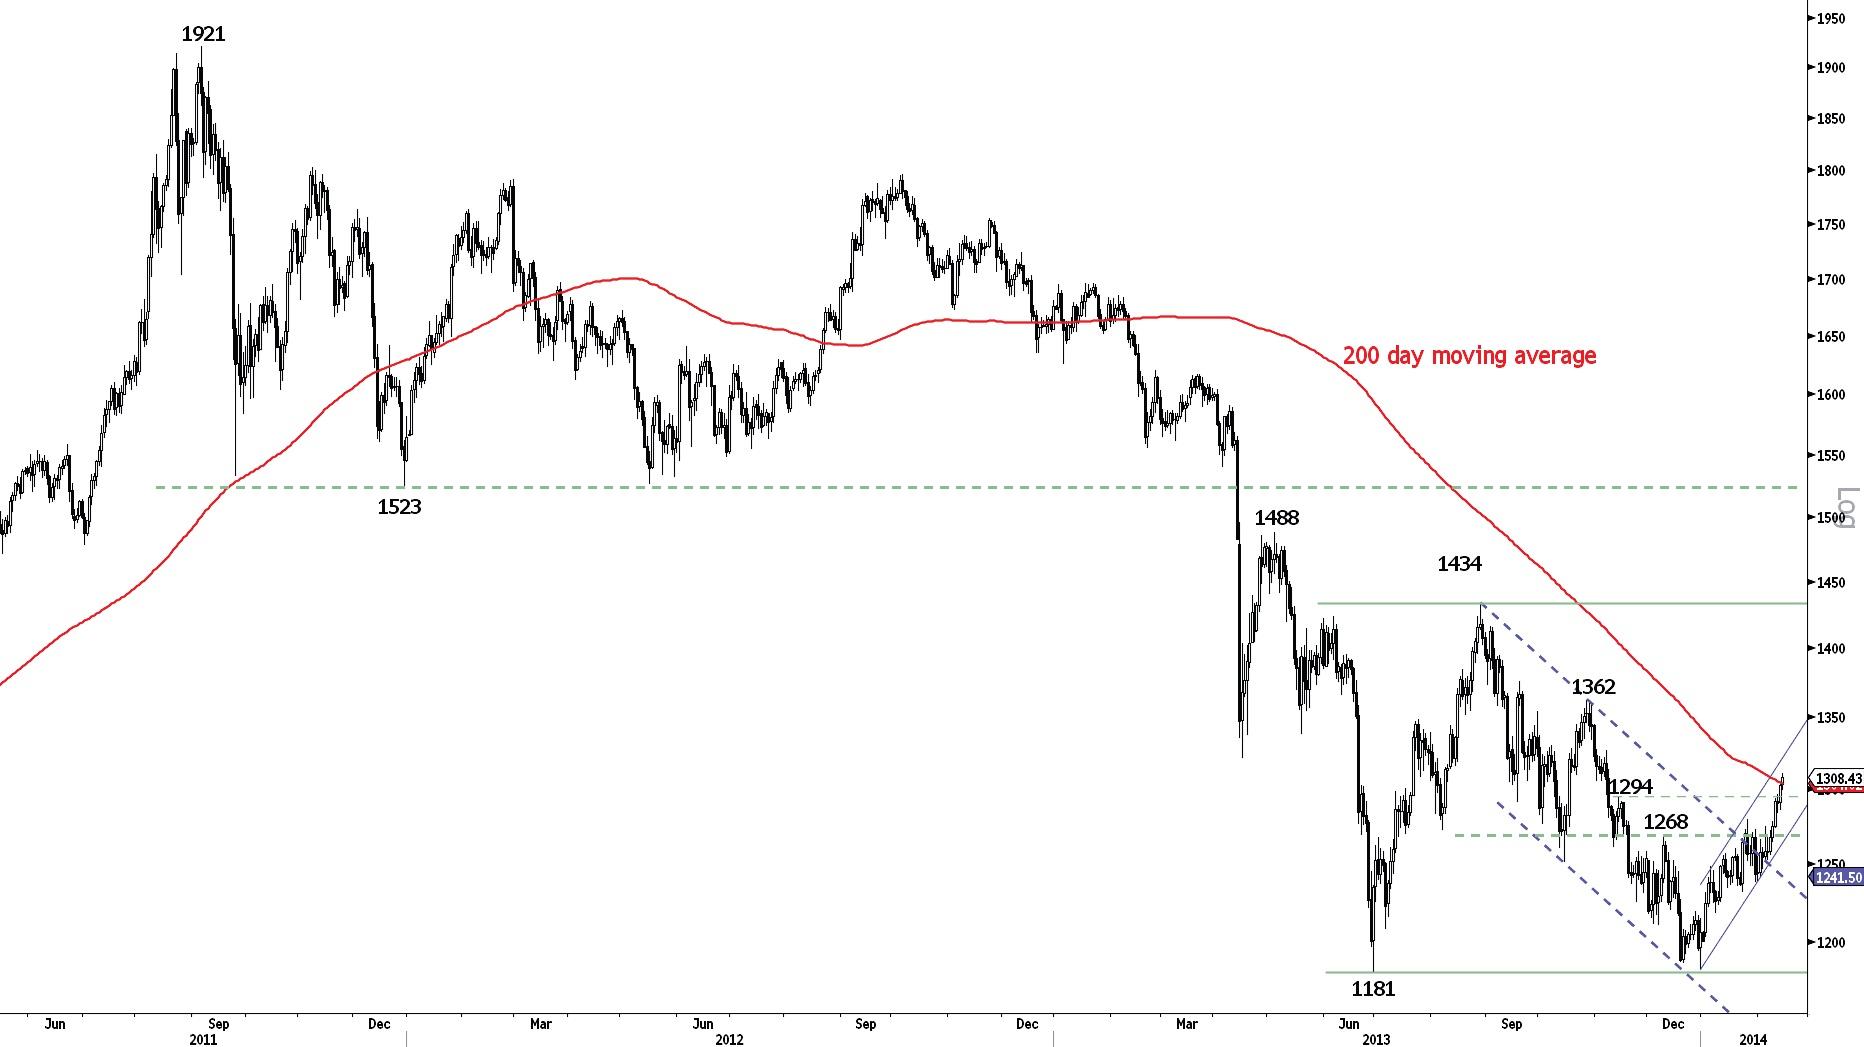
Rises above the 200 day moving average.
Gold has broken the resistance at 1294 and is moving above its 200 day moving average. Next resistances can be found at 1327 (07/11/2013 high) and 1362. The short-term uptrend remains positive as long as the support at 1284 (12/02/2014 low). Another support is given by the rising channel (around 1263).
Longer term, we continue to view the rise from 1181 (28/06/2013 low) as a counter-trend move within an underlying bearish trend. Therefore the test of the key support at 1181 is seen as the minimum downside risk. A decisive break of the resistance implied by the 200 day moving average (around 1305) is needed to improve our technical outlook. Another key support stands at 1045 (05/02/2010 low).
Await fresh signal.
SILVER (in USD)
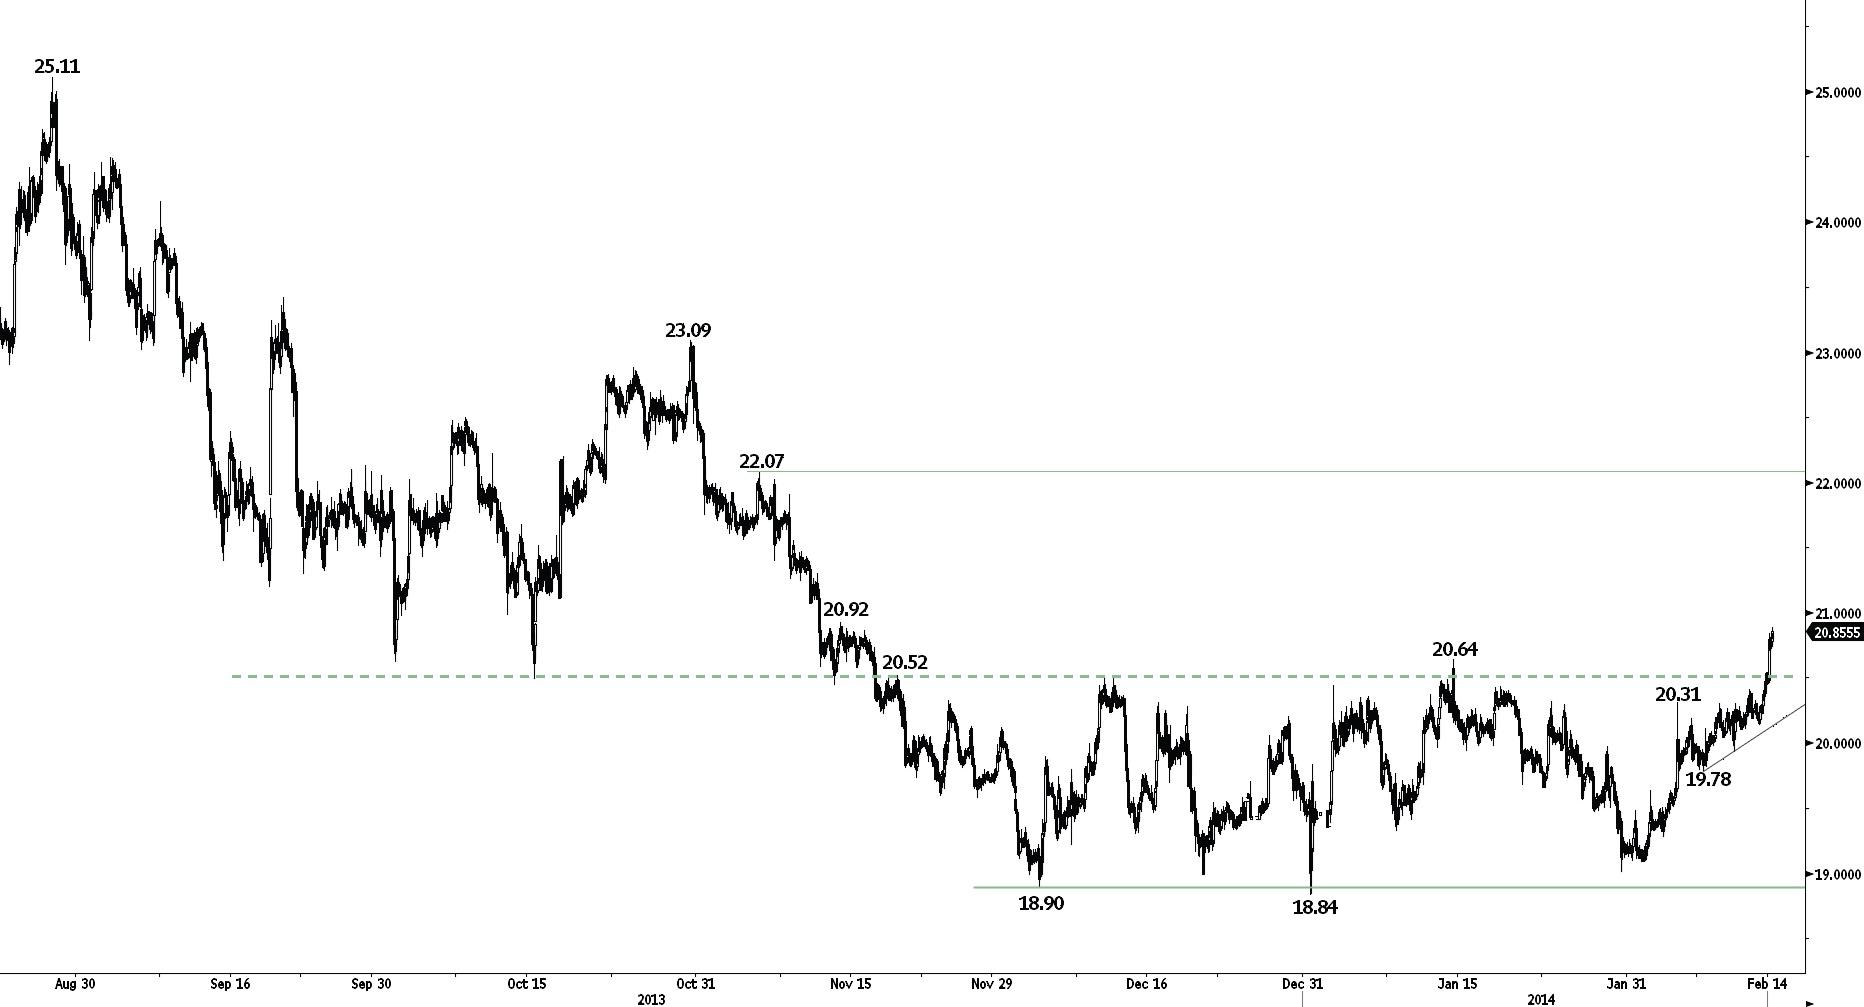
Breaking out of its horizontal consolidation.
Silver has broken the key resistance at 20.52, moving out of a three month horizontal range. The implied target is 22.12. Monitor the test of the resistance at 20.92 (see also the 200 day moving average). Another resistance can be found at 22.07 (06/11/2013 high). Hourly supports can be found at 20.46 (intraday low) and 20.10 (12/02/2014 low).
In the long-term, the trend is negative. However, the potential higher low at 18.84 (31/12/2013 low) suggests a phase of stabilisation. A key resistance now stands at 23.09.
Await fresh signal.
Recommended Content
Editors’ Picks
EUR/USD edges lower toward 1.0700 post-US PCE

EUR/USD stays under modest bearish pressure but manages to hold above 1.0700 in the American session on Friday. The US Dollar (USD) gathers strength against its rivals after the stronger-than-forecast PCE inflation data, not allowing the pair to gain traction.
GBP/USD retreats to 1.2500 on renewed USD strength

GBP/USD lost its traction and turned negative on the day near 1.2500. Following the stronger-than-expected PCE inflation readings from the US, the USD stays resilient and makes it difficult for the pair to gather recovery momentum.
Gold struggles to hold above $2,350 following US inflation

Gold turned south and declined toward $2,340, erasing a large portion of its daily gains, as the USD benefited from PCE inflation data. The benchmark 10-year US yield, however, stays in negative territory and helps XAU/USD limit its losses.
Bitcoin Weekly Forecast: BTC’s next breakout could propel it to $80,000 Premium

Bitcoin’s recent price consolidation could be nearing its end as technical indicators and on-chain metrics suggest a potential upward breakout. However, this move would not be straightforward and could punish impatient investors.
Week ahead – Hawkish risk as Fed and NFP on tap, Eurozone data eyed too

Fed meets on Wednesday as US inflation stays elevated. Will Friday’s jobs report bring relief or more angst for the markets? Eurozone flash GDP and CPI numbers in focus for the Euro.
