Briefly: In our opinion, no speculative positions are justified.
Our intraday outlook is neutral, and our short-term outlook is neutral. Our medium-term outlook remains bearish, as the S&P 500 index extends its lower highs, lower lows sequence:
Intraday outlook (next 24 hours): neutral
Short-term outlook (next 1-2 weeks): neutral
Medium-term outlook (next 1-3 months): bearish
Long-term outlook (next year): neutral
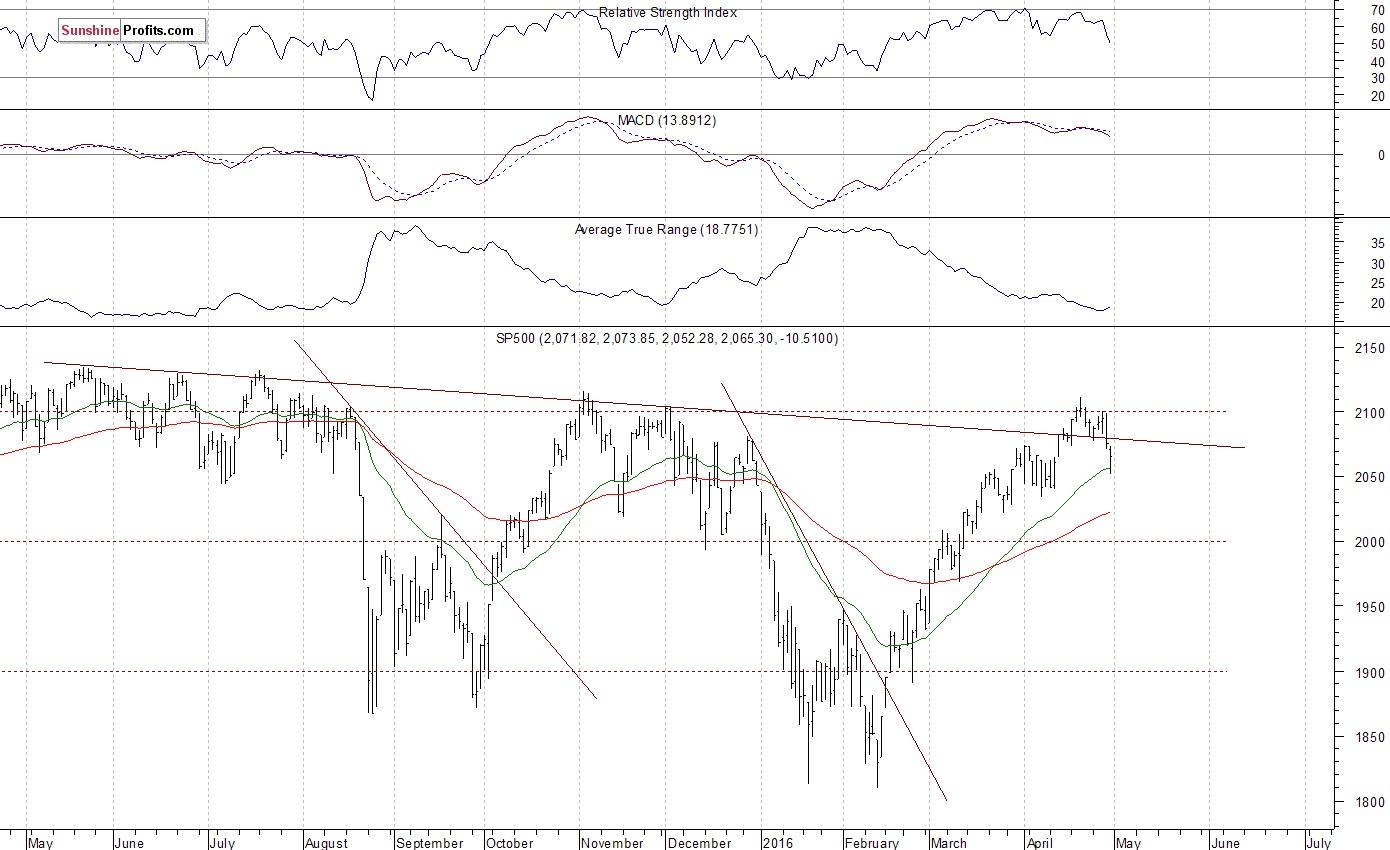
The U.S. stock market indexes lost between 0.3% and 0.5% on Friday, extending their short-term downtrend, as investors reacted to economic data, quarterly earnings releases. The S&P 500 index broke below its recent consolidation. Then it got close to support level of 2,050. However, the index has managed to bounce off that support level and close its trading session at around 2,065. On the other hand, resistance level is at 2,070-2,075, marked by the recent consolidation. The next level of resistance remains at 2,100-2,115, marked by last year's medium-term local highs. Is this the end of two-month long uptrend? Or is this just a correction before another leg up reaching last year's all-time high? We still can some see technical overbought conditions:
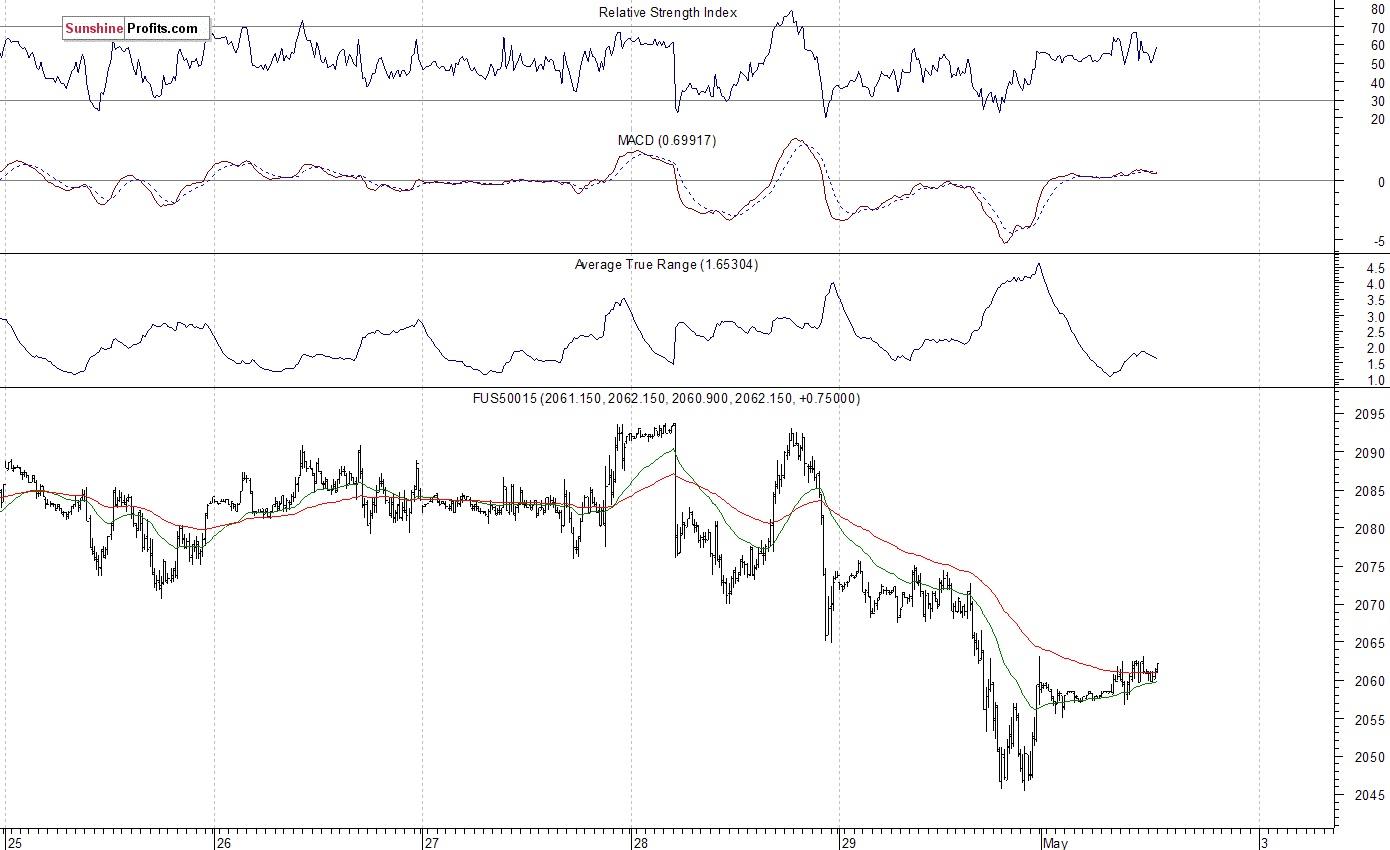
Expectations before the opening of today's trading session are virtually flat. The European stock market indexes have gained 0.4-0.8% so far. Investors will now wait for some economic data announcements: ISM Index, Construction Spending at 10:00 a.m. The S&P 500 futures contract trades within an intraday consolidation, following its Friday's volatility. The nearest important level of support is at 2,045-2,050, marked by Friday's local low. On the other hand, resistance level is at 2,070, marked by recent fluctuations. The market broke below its slightly descending short-term trading channel, as we can see on the 15-minute chart:
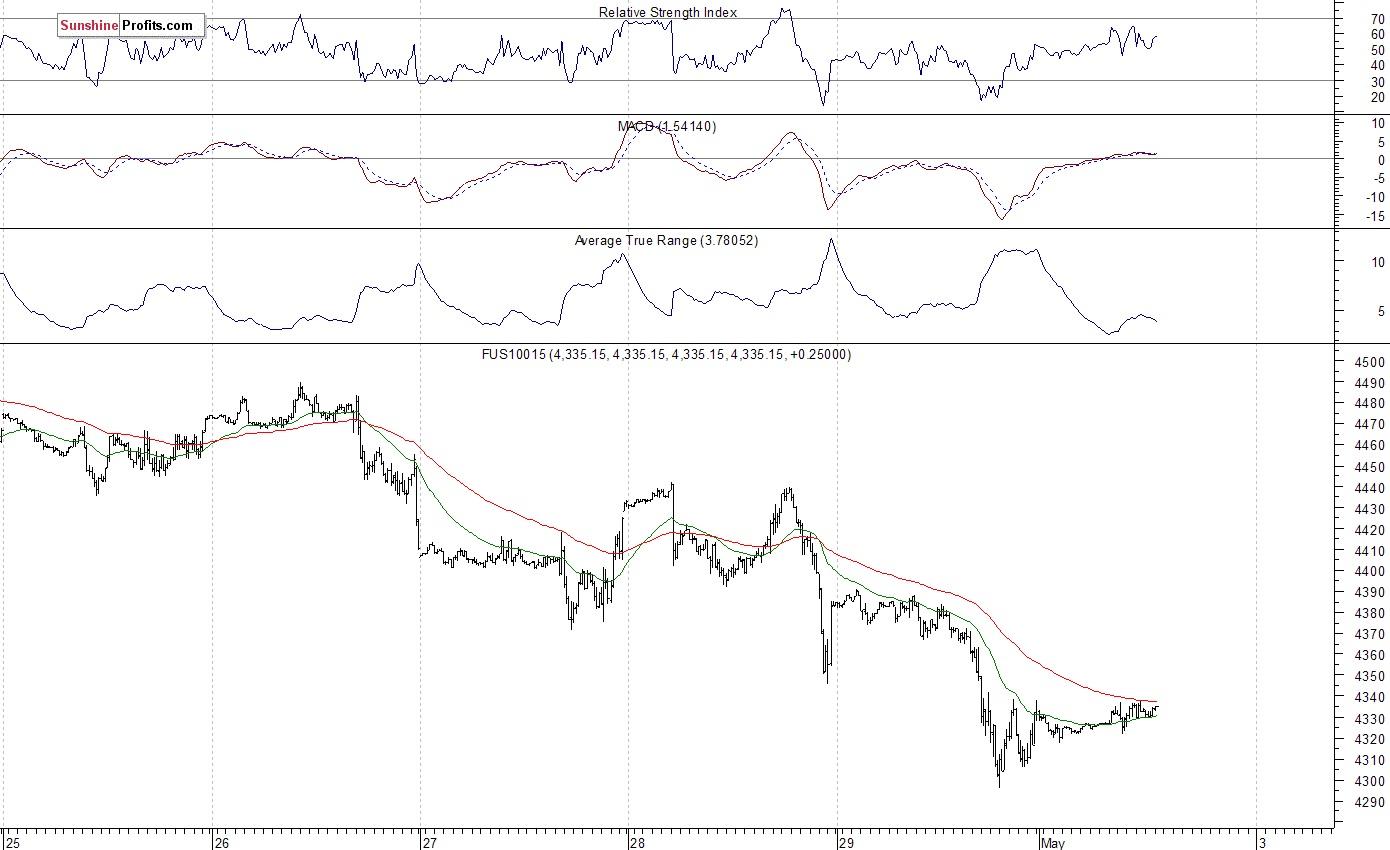
The technology Nasdaq 100 futures contract follows a similar path, as it trades within an intraday consolidation following Friday's move down. The nearest important level of support is at 4,290-4,300., and resistance level is at 4,330-4,350, among others. There have been no confirmed short-term positive signals so far. However, the market may be forming some bottoming pattern, as the 15-minute chart shows:
Concluding, the broad stock market extended its short-term move down on Friday. Is this a new downtrend or just consolidation following February - April rally? We still can see technical overbought conditions that may lead to uptrend's reversal or downward correction. However, there have been no confirmed negative signals so far. For now, it looks like a relatively flat correction within two-month-long medium-term uptrend. We prefer to be out of the market, avoiding low risk/reward ratio trades. We will let you know when we think it is safe to get back in the market.
All essays, research and information found above represent analyses and opinions of Przemyslaw Radomski, CFA and Sunshine Profits' employees and associates only. As such, it may prove wrong and be a subject to change without notice. Opinions and analyses were based on data available to authors of respective essays at the time of writing. Although the information provided above is based on careful research and sources that are believed to be accurate, Przemyslaw Radomski, CFA and his associates do not guarantee the accuracy or thoroughness of the data or information reported. The opinions published above are neither an offer nor a recommendation to purchase or sell any securities. Mr. Radomski is not a Registered Securities Advisor. By reading Przemyslaw Radomski's, CFA reports you fully agree that he will not be held responsible or liable for any decisions you make regarding any information provided in these reports. Investing, trading and speculation in any financial markets may involve high risk of loss. Przemyslaw Radomski, CFA, Sunshine Profits' employees and affiliates as well as members of their families may have a short or long position in any securities, including those mentioned in any of the reports or essays, and may make additional purchases and/or sales of those securities without notice.
Recommended Content
Editors’ Picks
EUR/USD edges lower toward 1.0700 post-US PCE

EUR/USD stays under modest bearish pressure but manages to hold above 1.0700 in the American session on Friday. The US Dollar (USD) gathers strength against its rivals after the stronger-than-forecast PCE inflation data, not allowing the pair to gain traction.
GBP/USD retreats to 1.2500 on renewed USD strength

GBP/USD lost its traction and turned negative on the day near 1.2500. Following the stronger-than-expected PCE inflation readings from the US, the USD stays resilient and makes it difficult for the pair to gather recovery momentum.
Gold struggles to hold above $2,350 following US inflation

Gold turned south and declined toward $2,340, erasing a large portion of its daily gains, as the USD benefited from PCE inflation data. The benchmark 10-year US yield, however, stays in negative territory and helps XAU/USD limit its losses.
Bitcoin Weekly Forecast: BTC’s next breakout could propel it to $80,000 Premium

Bitcoin’s recent price consolidation could be nearing its end as technical indicators and on-chain metrics suggest a potential upward breakout. However, this move would not be straightforward and could punish impatient investors.
Week ahead – Hawkish risk as Fed and NFP on tap, Eurozone data eyed too

Fed meets on Wednesday as US inflation stays elevated. Will Friday’s jobs report bring relief or more angst for the markets? Eurozone flash GDP and CPI numbers in focus for the Euro.