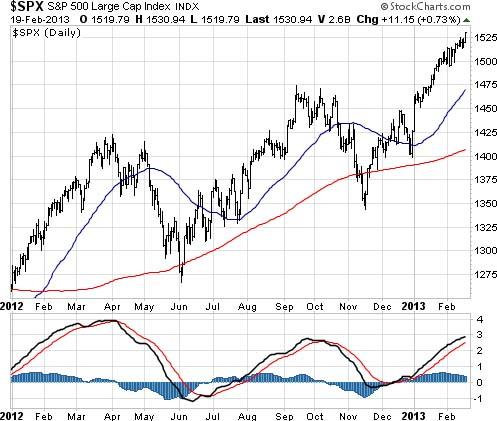
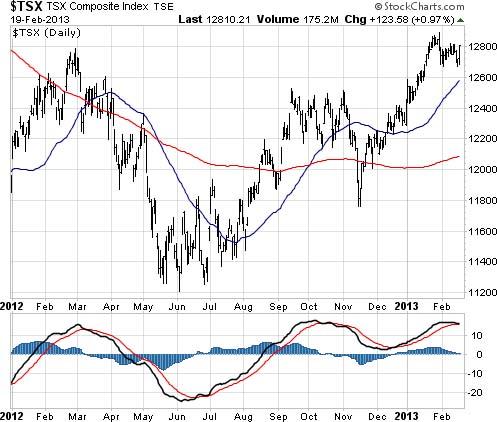
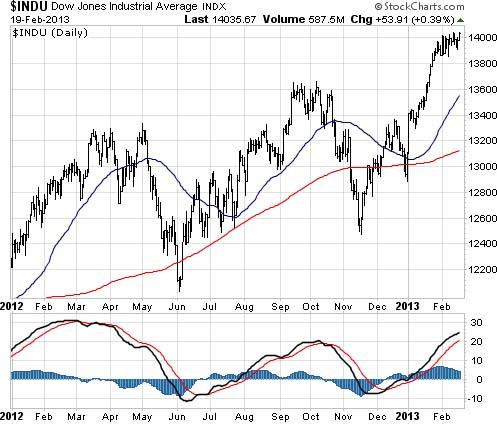
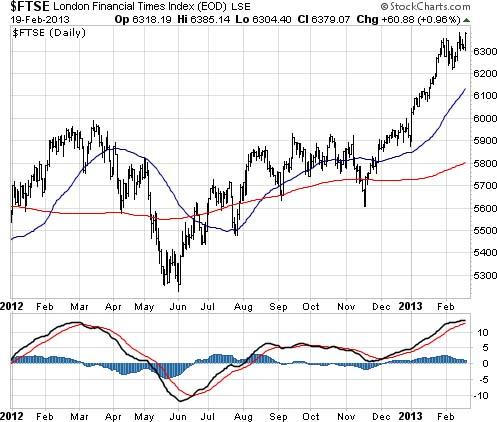
Seven weeks into 2013 and the old, but seemingly ageless, bull market continues to purr along. The market action since the beginning of the year has three important features: (1) many of the major market indices have broken out to new highs for this bull market; (2) new leaders continue to emerge amongst individual stocks and sectors; and (3) there is a greater sense of investor conviction and enthusiasm.
Up-side breakouts. In our last Market Comment at the end of January we concluded that “there is no doubt that this market wants to go higher.” The markets had many factors in their favor: the 105- day and 39-week cycles were pointing up; market breadth was positive; price patterns of “rising highs and rising lows” were clearly visible; and 50-day and 200- day Moving Averages were mostly rising.
Breakouts have now occurred in the S&P 500, the Dow Industrials and in London. The Dow Transports also achieved a new high, putting Dow Theory firmly into a bullish mode once again after some months of uncertainty. Toronto’s S&P/TSX Composite Index has cleared some of its shorter-term resistance, but still needs to move higher to fully confirm a major breakout. And the NASDAQ is probing near a new high.
New leadership. A strong market renews its health and vigor with new leaders. We are seeing breakouts in General Electric, Proctor & Gamble and Hertz and the appearance of new sector leadership. Most importantly, the daily cumulative NYSE advance/decline line (often a leading indicator of important trend changes) continues to perform strongly.
Growing conviction. For four years, many have either avoided, or been highly skeptical of this bull market. We sense the mood is slowly changing. More frequently the question is being posed: “is it time to buy stocks?” And the media seem to be more interested in the markets than at any time since the dark days of early 2009.
Coming after nearly four years of bullish action, what is the significance of these recent moves to the upside, leadership rotation, and growing investor confidence? On the positive side, many of the moves – most notably by the S&P 500 – have occurred within a framework characterized by a multi-year pattern of rising prices. All-time highs are tantalizingly close for some of the major market indices; and short-term resistance has been overcome.
But there are reasons for caution in the near-term. The markets have been rising since mid-November, and the distance between the indices and their respective 200-day Moving Averages is at levels that are often associated with pullbacks. Negative internal momentum divergences are beginning to appear in many major market indices, many stocks are above their 50-day Moving Averages, and the number of stocks making new highs is starting to decline. The Volatility Index (the VIX) suggests a degree of complacency. The 105-day cycle is also nearing its end.
In sum, the markets are technically strong but short-term overbought. A pause or pull back at some point is likely, but the overall robustness of the markets may mean that a pull back is delayed and modest in size.
The January indicator (“as January goes for the S&P 500 so goes the entire year”), which has a forecast accuracy of nearly 90% since 1950, suggests that 2013 will be a positive year. Does the strong start to the year challenge our expectation outlined in a recent Market Comment that 2013 will be the final year of this bull market? The recent breakouts in major market indices increased the odds of a rising market well into late 2013 or even into early 2014. But we are still of the view that an end to this bull market and a prolonged period of weakness are looming, with the next significant market low to occur sometime in 2014, coinciding with the next 4-year cycle low.
Another possibility suggested by the January indicator is that the markets will be net positive for 2013 (confirming the January indictor), but that significant weakness could occur by late 2013 and then continue into 2014. Under this scenario we might see new all-time market highs this year, but rapid deterioration as the year-end approaches.
The “fat lady has yet to sing” in London, where the market’s breakout indicates that the bull market is far from dead. Historically, London has a history of leading New York, which in turn leads Toronto. In addition, the recent breakouts do not appear to be “exhaustion” style moves (which would see high volume and rampant enthusiasm, neither of which exists). This combines to suggest that 2013 will see further extension on the upside at some point.
The Toronto market is shaping up as this late-stage bull market’s wild card. This commodity-focused major market Index moves strongly at the end of a bull market. That has yet to happen. The longer this is delayed, the longer it is likely that the bull market will last. In other words, an early move to the upside in Toronto – meaning a powerful move above 13,000 – could indicate an earlier end for the bull. Energy stocks are showing some signs of life, but the Materials and Golds continue to struggle, and this suggests that Toronto’s moment in the limelight might be later rather than sooner in 2013.
The 105-day calendar cycle is now pointing down, with a scheduled maturation point in mid-March. The shorter-term 21-day cycle matures at the end of this week, with the following 21- day cycle completing the set of five of these cycles in the 105-day period. This means that the markets will be under some downward cyclical pressure for the next few weeks. Another boost to the upside should follow as a new 105-day cycle combines with the still-positive 39- week cycle.
We have said repeatedly in recent Market Comments that astute stock selection, in the right sectors and appropriate stocks are the keys to success in this late-stage bull market. Our answer to the question “is it time to buy stocks” is “yes, but only technically strong stocks”. If our perception about sector rotation is correct, being nimble and avoiding “marriage” to a stock will be essential this year.
The bull market has entered a new phase in 2013. Its fifth year, which will begin in March, will likely see further gains, more upside surprises, and extended rallies for many technically strong stocks. The question remains: when will we see the appearance of the major technical nonconfirmations, breakdowns in major market indices, and investor over-enthusiasm and belief that normally characterize the end phase of a bull market? Our answer is: we aren’t there just yet!
S&P 500 Index
The S&P 500 has been advancing strongly for three months. But February has been characterized by a loss of internal momentum even as the Index chugs higher. This, coupled with the distance from the rising 200-day Moving Average and resistance in the low 1,500s, suggests that a pull back or a pause is very likely in the weeks ahead.
The S&P 500 looks like it might make an attempt at its all-time high of 1,576 before this bull market ends. The upper trend line of the 2009-2013 bull market is at about 1,650. But some resting and gathering of strength will be necessary before the S&P 500 is capable of launching itself towards either of these two targets.
S&P/TSX Composite Index
Toronto continues to be on the verge of something big. A large “W” base pattern has formed over the past year, and the move above 12,600 in January points to further advances. To clinch the deal the S&P/TSX Composite Index needs to rise above 13,000. For this to occur, the big base and late-stage leadership from the Energy and Materials sectors must provide fuel. Once over 13,000, the road is open for a run towards the all-time highs in the low 15,000s.
Shorter-term, Toronto could use a pull back towards the mid- to low-12,000s. This would re-connect the Index with its rising 200-day Moving Average, and provide some further strength for a conclusive and sustained breakout above 13,000.
Dow Jones Industrials Index
The recent strong rise in both the Dow Industrials and the Dow Transports strengthens the case that the Industrials have got the strength to make a run towards its all-time high of 14,093.
The Dow Industrials are currently overbought and there is a small negative divergence in the Index’s internal momentum indicators.
There is good near-term support in the 13,500 (50-day Moving Average) to 13,600 range. A resting phase now after three months of advance would be useful in order to set up the next rally. The Index needs to stay above 12,900 to preserve the pattern of rising highs and rising lows.
FTSE 100
The FTSE’s move out of its large base, at the beginning of 2013, overcoming multi-year resistance, is very significant. The London market has now approached its immediate target of 6,400, and a move to challenge the 2007 alltime high near 6,750 is definitely possible sometime this year.
The FTSE’s action in the last few weeks is characteristic of a strong market. Three months of strong advance and a break through strong resistance has been followed by an understandable loss of internal momentum. In short, the FTSE needs a rest.
The 6,100 level, which is the breakout level as well as the location of the rising 50-day Moving Average, should provide good support for any pull back. To confuse market participants, the FTSE could pull back to slightly below 6,000, but should this occurs, it will be a major buying opportunity. The FTSE has waited years for this recent breakout. It wants to go higher, and it should do so in the months ahead.
(C) Copyright 2012, Phases & Cycles Inc. All Rights Reserved. The contents of this report may NOT be copied, reproduced, or distributed without the explicit written consent of Phases & Cycles Inc.
The opinions and projections contained herein are those of Phases & Cycles Inc., its principals, associates and employees (“the researchers”) and are subject to change without notice. The information contained herein has been obtained from sources that we believe to be reliable but cannot guarantee its accuracy or completeness. This report is not and under no circumstances is to be construed as an offer to sell or the solicitation of an offer to buy any securities. This report is furnished on the basis and understanding that “the researchers” are to be under no responsibility or liability whatsoever in respect thereof. “The researchers” may, from time to time, buy, own or sell securities mentioned herein. “Phases & Cycles” is a registered trademark of 104443 Canada Inc.
Recommended Content
Editors’ Picks
EUR/USD edges lower toward 1.0700 post-US PCE

EUR/USD stays under modest bearish pressure but manages to hold above 1.0700 in the American session on Friday. The US Dollar (USD) gathers strength against its rivals after the stronger-than-forecast PCE inflation data, not allowing the pair to gain traction.
GBP/USD retreats to 1.2500 on renewed USD strength

GBP/USD lost its traction and turned negative on the day near 1.2500. Following the stronger-than-expected PCE inflation readings from the US, the USD stays resilient and makes it difficult for the pair to gather recovery momentum.
Gold struggles to hold above $2,350 following US inflation

Gold turned south and declined toward $2,340, erasing a large portion of its daily gains, as the USD benefited from PCE inflation data. The benchmark 10-year US yield, however, stays in negative territory and helps XAU/USD limit its losses.
Bitcoin Weekly Forecast: BTC’s next breakout could propel it to $80,000 Premium

Bitcoin’s recent price consolidation could be nearing its end as technical indicators and on-chain metrics suggest a potential upward breakout. However, this move would not be straightforward and could punish impatient investors.
Week ahead – Hawkish risk as Fed and NFP on tap, Eurozone data eyed too

Fed meets on Wednesday as US inflation stays elevated. Will Friday’s jobs report bring relief or more angst for the markets? Eurozone flash GDP and CPI numbers in focus for the Euro.


