![]() Nick Mastrandrea
Nick Mastrandrea
Market Tea Leaves
Good Morning Traders,
As of this writing 4:20 AM EST, here’s what we see:
US Dollar: Up at 94.280 the US Dollar is up 335 ticks and trading at 94.280.
Energies: May Crude is down at 41.65.
Financials: The June 30 year bond is up 6 ticks and trading at 165.07.
Indices: The June S&P 500 emini ES contract is up 35 ticks and trading at 2064.50.
Gold: The June gold contract is trading down at 1261.70. Gold is 92 ticks lower than its close.
Initial Conclusion
This is a nearly correlated market. The dollar is up+ and crude is down- which is normal and the 30 year bond is trading higher. The Financials should always correlate with the US dollar such that if the dollar is lower then bonds should follow and vice-versa. The indices are up and Crude is trading lower which is correlated. Gold is trading down which is correlated with the US dollar trading up. I tend to believe that Gold has an inverse relationship with the US Dollar as when the US Dollar is down, Gold tends to rise in value and vice-versa. Think of it as a seesaw, when one is up the other should be down. I point this out to you to make you aware that when we don’t have a correlated market, it means something is wrong. As traders you need to be aware of this and proceed with your eyes wide open.
All of Asia traded higher. As of this writing all of Europe is trading higher.
Possible Challenges To Traders Today
- Core Retails Sales is out at 8:30 AM EST. This is major.
- Retail Sales is out at 8:30 AM EST. This is major.
- Core PPI is out at 8:30 AM EST. This is major.
- PPI is out at 8:30 AM EST. This is major.
- Business Inventories m/m is out at 10 AM EST. This is not major.
- Crude Oil Inventories is out at 10:30 AM EST. This is major.
- 10-y Bond Auction starts at 1 PM EST. This could effect afternoon trading.
- Beige Book is out at 2 PM EST. This is major.
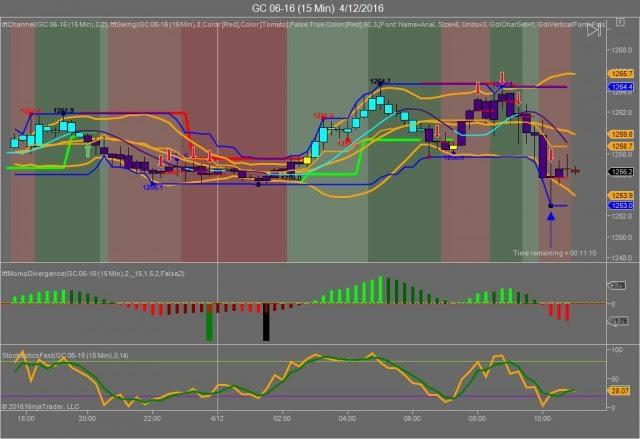
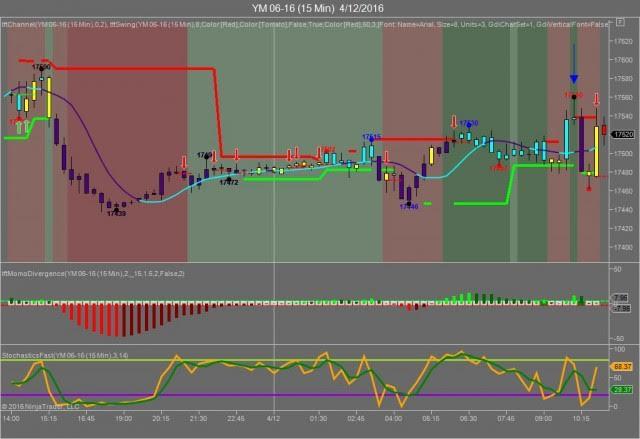
Gold
We’ve elected to switch gears a bit and show correlation between Gold and The YM futures contract. The YM contract is the DJIA and the purpose is to show reverse correlation between the two instruments. Remember it’s liken to a seesaw, when up goes up the other should go down and vice versa.
Yesterday Gold made it’s move at 10:15 AM EST with no economic news in sight. The YM hit a high at around that time and Gold hit a low. If you look at the charts below the YM gave a signal at around 10:15 AM EST, while Gold also gave a signal at just about the same time. Look at the charts below and you’ll see a pattern for both assets. The YM hit a high at around 10:15 AM EST and Gold hit a low. These charts represent the latest version of Trend Following Trades and I’ve changed the timeframe to a 15 minute chart to display better. This represented a long opportunity on Gold, as a trader you could have netted 30-40 plus ticks per contract on this trade. Each tick is worth $10. We added a Donchian Channel to the charts to show the signals more clearly.
Charts Courtesy of Trend Following Trades built on a NinjaTrader platform
Bias
Yesterday we gave the markets a neutral bias as the futures had no sense of direction yesterday morning. A neutral bias means the markets could go in any direction. The Dow gained 165 points. The other indices gained ground as well. Today we’re dealing with a nearly correlated market and it’s correlated to the upside. Hence our bias is to the upside.
Could this change? Of Course. Remember anything can happen in a volatile market.
Commentary
Monday evening Alcoa reported their earnings and this is the unofficial start of earnings season. Needless to say Alcoa reported earnings that were less than stellar; citing the high cost of aluminum as a factor. Yesterday the markets chose to ignore this and went higher. Why? Perhaps it’s felt that the Fed will go slowly when it comes to hiking rates. After all elsewhere in the globe markets are enjoying low interest rates and it’s felt that the Fed should be accommodative as well. Today we get Retail Sales and PPI which should give us some clue as to what the economy’s up to….
Trading performance displayed herein is hypothetical. The following Commodity Futures Trading Commission (CFTC) disclaimer should be noted.
Hypothetical performance results have many inherent limitations, some of which are described below. No representation is being made that any account will or is likely to achieve profits or losses similar to those shown.
In fact, there are frequently sharp differences between hypothetical performance results and the actual results subsequently achieved by any particular trading program. One of the limitations of hypothetical performance trading results is that they are generally prepared with the benefit of hindsight.
In addition, hypothetical trading does not involve financial risk, and no hypothetical trading record can completely account for the impact of financial risk in actual trading. For example, the ability to withstand losses or to adhere to a particular trading program in spite of trading losses are material points which can also adversely affect actual trading results.
There are numerous other factors related to the markets in general or to the implementation of any specific trading program which cannot be fully accounted for in the preparation of hypothetical performance results and all of which can adversely affect actual trading results.
Trading in the commodities markets involves substantial risk and YOU CAN LOSE A LOT OF MONEY, and thus is not appropriate for everyone. You should carefully consider your financial condition before trading in these markets, and only risk capital should be used.
In addition, these markets are often liquid, making it difficult to execute orders at desired prices. Also, during periods of extreme volatility, trading in these markets may be halted due to so-called “circuit breakers” put in place by the CME to alleviate such volatility. In the event of a trading halt, it may be difficult or impossible to exit a losing position.
Recommended Content
Editors’ Picks
EUR/USD edges lower toward 1.0700 post-US PCE

EUR/USD stays under modest bearish pressure but manages to hold above 1.0700 in the American session on Friday. The US Dollar (USD) gathers strength against its rivals after the stronger-than-forecast PCE inflation data, not allowing the pair to gain traction.
GBP/USD retreats to 1.2500 on renewed USD strength

GBP/USD lost its traction and turned negative on the day near 1.2500. Following the stronger-than-expected PCE inflation readings from the US, the USD stays resilient and makes it difficult for the pair to gather recovery momentum.
Gold struggles to hold above $2,350 following US inflation

Gold turned south and declined toward $2,340, erasing a large portion of its daily gains, as the USD benefited from PCE inflation data. The benchmark 10-year US yield, however, stays in negative territory and helps XAU/USD limit its losses.
Bitcoin Weekly Forecast: BTC’s next breakout could propel it to $80,000 Premium

Bitcoin’s recent price consolidation could be nearing its end as technical indicators and on-chain metrics suggest a potential upward breakout. However, this move would not be straightforward and could punish impatient investors.
Week ahead – Hawkish risk as Fed and NFP on tap, Eurozone data eyed too

Fed meets on Wednesday as US inflation stays elevated. Will Friday’s jobs report bring relief or more angst for the markets? Eurozone flash GDP and CPI numbers in focus for the Euro.