![]() Nadia Simmons
Nadia Simmons
Sunshine Profits
Although the world's largest oil‐producing countries met this weekend in Doha, they failed to reach a deal to freeze output at Jan levels as Saudi deputy crown prince Mohammed bin Salman sustained earlier statement that Saudi Arabia would freeze the level of its oil production only if all other major producers (including Iran) did the same. Although Iran supported the freeze, the country didn’t agree to cut production until it raises its output to around 4 million barrels per day (to the pre‐sanctions levels). What does it mean for crude oil? In our opinion, such developments suggest a renewed battle for crude market share, which would likely translate into lower values of the commodity in the coming days or even weeks. Will our interesting ratios confirm this scenario? Let’s jump right into charts.
Let’s start today’s article with the oil‐to‐silver ratio.
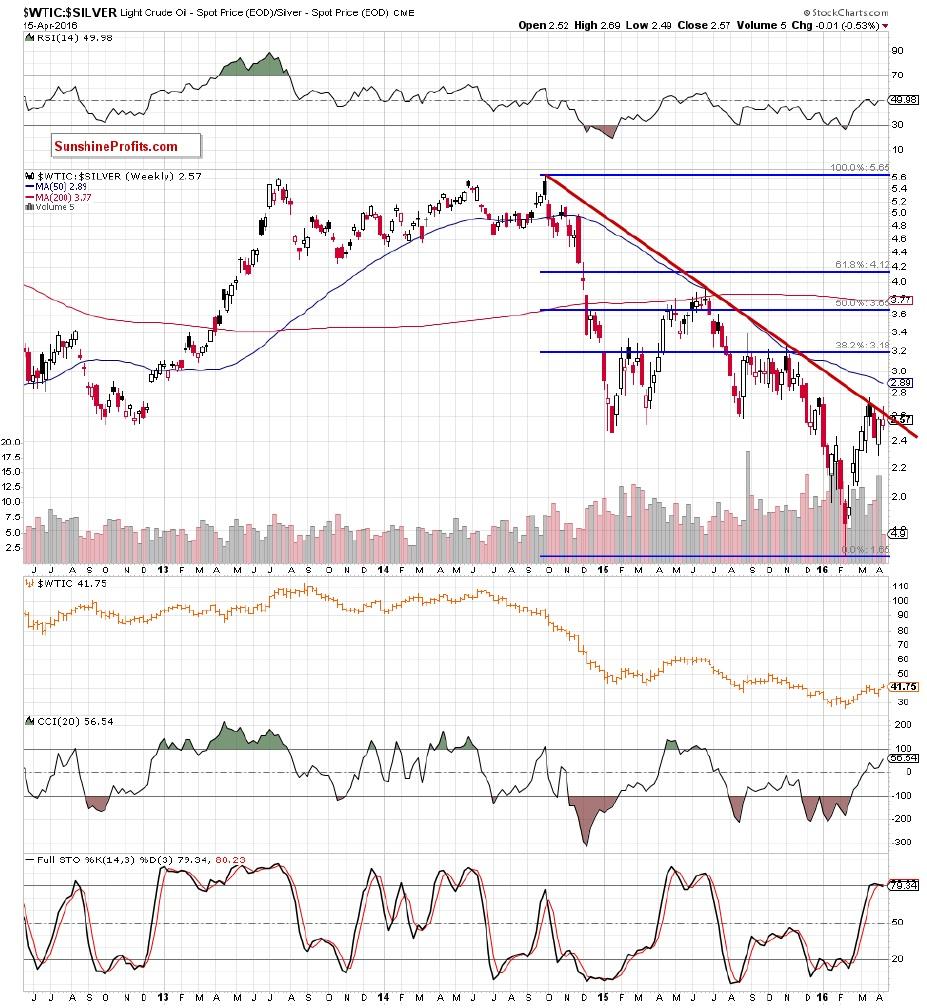
On the above chart, we clearly see that although the ratio moved slightly above the longterm red declining line, this improvement was only temporary and the ratio reversed, closing the previous week under this key resistance – similarly to what we saw several times in the past. As you see in all cases, oil bulls were not strong enough to push the ratio higher, which resulted in reversal and declines – not only in the ratio, but also in crude oil. Therefore, looking at the above chart, we think that anther reversal is just around the corner – especially when we factor in the fact that the Stochastic Oscillator is very close to generating a sell signal, which is another negative signal.
Having said the above, let’s take a closer look at the gold‐to‐oil ratio.
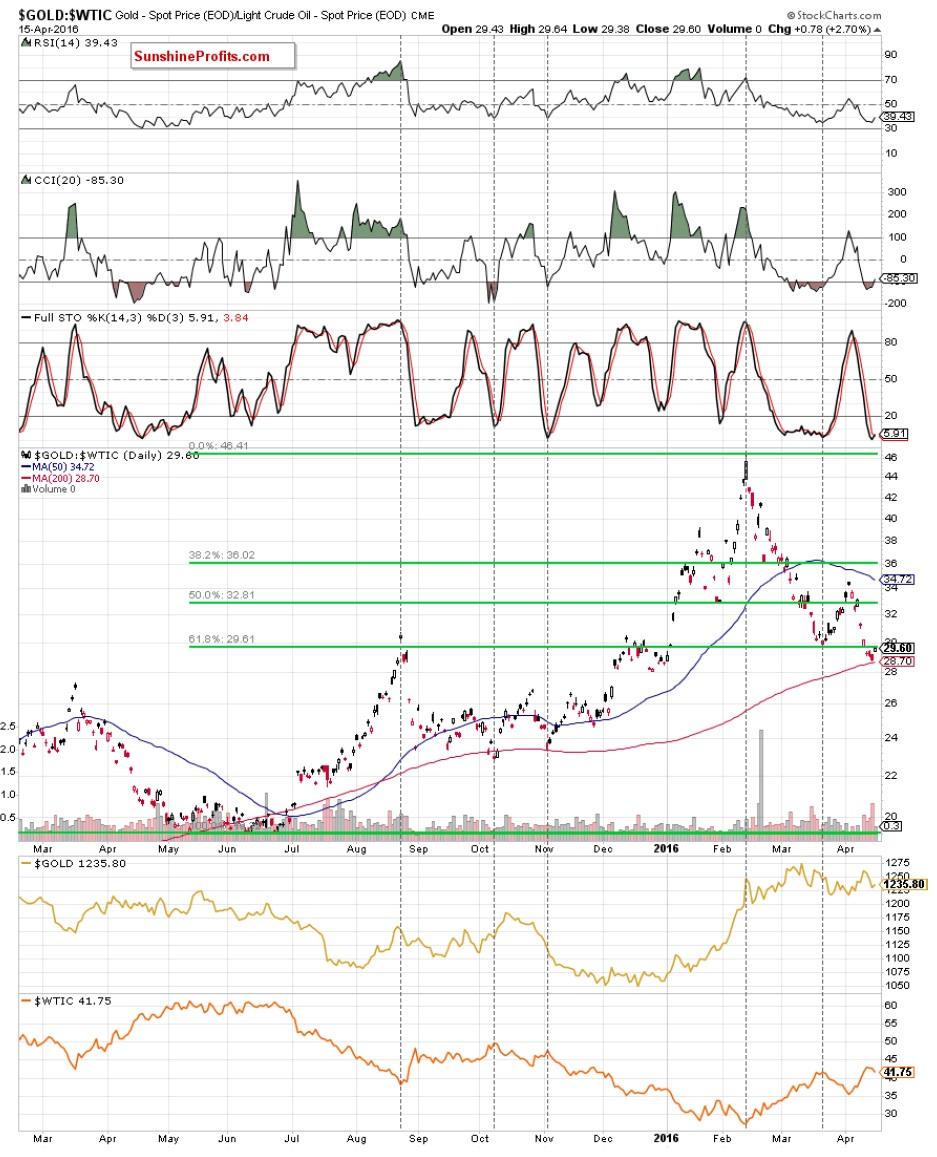
The first thing that catches the eye on the above chart is strong negative correlation between the ratio and the price of crude oil. In the previous week, the ratio declined to the 200‐day moving average, which in combination with the current position of the CCI and Stochastic Oscillator suggests that another reversal in the coming day(s) is very likely. Why? When we examined the above chart, we noticed similar situation in Oct and Nov 2015. Back then, such combination encouraged bears to act, which translated into higher values of the ratio and declines in crude oil. Therefore, if the history repeats itself once again, we’ll likely see another downward move in light crude.
Finishing today’s article, we would like to draw your attention to the non‐USD (WTIC:UDN ratio) chart of crude oil. As a reminder, UDN is the symbol for the PowerShares DB US Dollar Index Bearish Fund, which moves in the exact opposite direction to the USD Index. Since the USD Index is a weighted average of the dollar's exchange rates with world's most important currencies, the WTIC:UDN ratio displays the value of crude oil priced in "other currencies".
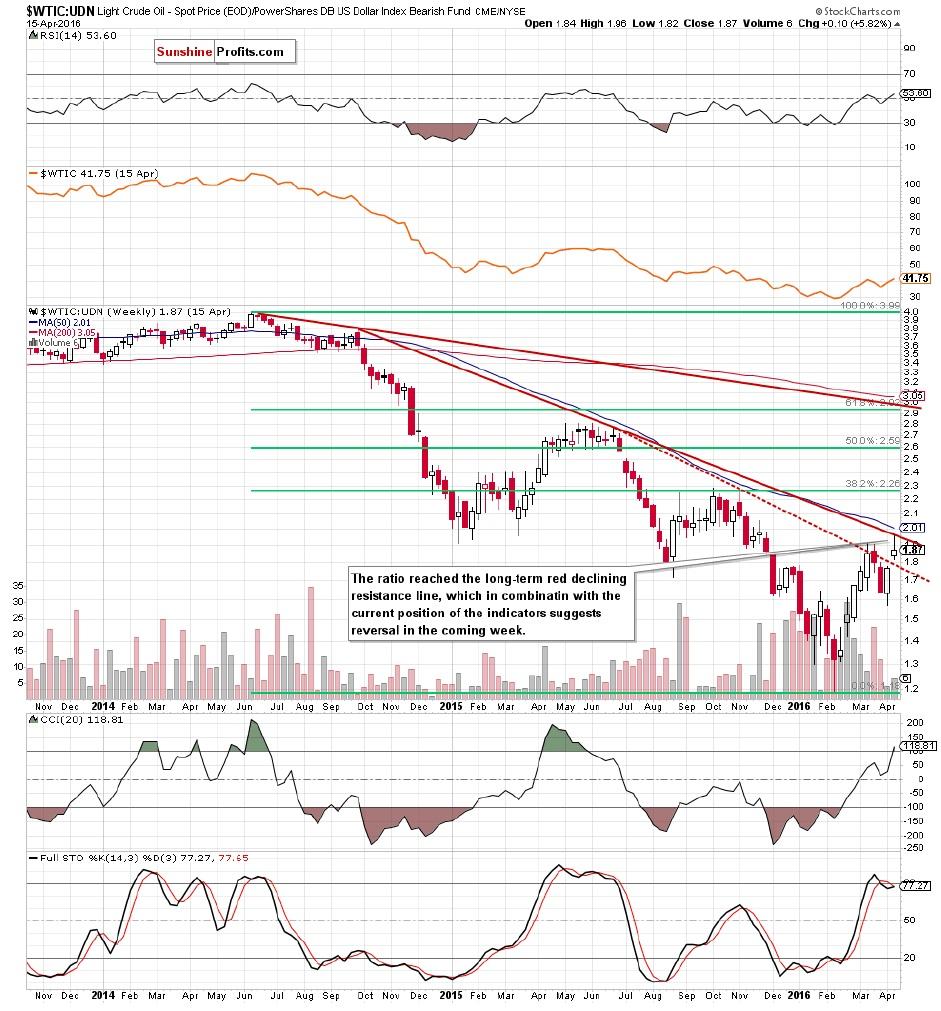
From the medium‐term perspective, we see that the red dashed resistance line stopped oil bulls and triggered a pullback, which approached the ratio to the 50% Fibonacci retracement earlier this month. Despite this drop, WTIC:UDN rebounded, invalidating earlier breakdown under this line, which resulted in an increase above the March high and a climb to the long‐term red declining resistance line (based on Sep 2014 and Jun 2015 highs). Taking this fact into account, the proximity to the 50‐week moving average and the current position of the indicators, we think another downswing is just around the corner.
Summing up, as you saw on the above charts, all our ratios suggests that lower values of crude oil are more likely than not. This scenario is also supported by the fact that all hopes of agreement between OPEC members and Russia to freeze output faded after weekend’s failure, suggesting a renewed battle for crude market share and lower values of the commodity in the coming days or even weeks. If you would like to know more about oil market and our interesting ratios, we encourage you to sign up for Oil Investment Update, Oil Trading Alerts or the All‐Inclusive Package that includes them.
All essays, research and information found above represent analyses and opinions of Przemyslaw Radomski, CFA and Sunshine Profits' employees and associates only. As such, it may prove wrong and be a subject to change without notice. Opinions and analyses were based on data available to authors of respective essays at the time of writing. Although the information provided above is based on careful research and sources that are believed to be accurate, Przemyslaw Radomski, CFA and his associates do not guarantee the accuracy or thoroughness of the data or information reported. The opinions published above are neither an offer nor a recommendation to purchase or sell any securities. Mr. Radomski is not a Registered Securities Advisor. By reading Przemyslaw Radomski's, CFA reports you fully agree that he will not be held responsible or liable for any decisions you make regarding any information provided in these reports. Investing, trading and speculation in any financial markets may involve high risk of loss. Przemyslaw Radomski, CFA, Sunshine Profits' employees and affiliates as well as members of their families may have a short or long position in any securities, including those mentioned in any of the reports or essays, and may make additional purchases and/or sales of those securities without notice.
Recommended Content
Editors’ Picks
EUR/USD edges lower toward 1.0700 post-US PCE

EUR/USD stays under modest bearish pressure but manages to hold above 1.0700 in the American session on Friday. The US Dollar (USD) gathers strength against its rivals after the stronger-than-forecast PCE inflation data, not allowing the pair to gain traction.
GBP/USD retreats to 1.2500 on renewed USD strength

GBP/USD lost its traction and turned negative on the day near 1.2500. Following the stronger-than-expected PCE inflation readings from the US, the USD stays resilient and makes it difficult for the pair to gather recovery momentum.
Gold struggles to hold above $2,350 following US inflation

Gold turned south and declined toward $2,340, erasing a large portion of its daily gains, as the USD benefited from PCE inflation data. The benchmark 10-year US yield, however, stays in negative territory and helps XAU/USD limit its losses.
Bitcoin Weekly Forecast: BTC’s next breakout could propel it to $80,000 Premium

Bitcoin’s recent price consolidation could be nearing its end as technical indicators and on-chain metrics suggest a potential upward breakout. However, this move would not be straightforward and could punish impatient investors.
Week ahead – Hawkish risk as Fed and NFP on tap, Eurozone data eyed too

Fed meets on Wednesday as US inflation stays elevated. Will Friday’s jobs report bring relief or more angst for the markets? Eurozone flash GDP and CPI numbers in focus for the Euro.