- Is risk sentiment back on?
- Will the ECB continue to turn a blind eye to EUR strength?
- Market Movers: Weekly Technical Outlook
- Look Ahead: Stocks
- Look Ahead: Commodities
- Data Highlights
Is risk sentiment back on?
Last week was full of extremes. At the start of the week escalating tensions between Russia and the Ukraine dominated sentiment. Risky assets sold off and stocks fell sharply. However, by Tuesday, when it looked like a violent outcome to the crisis was off the cards, the markets were able to put the Ukraine crisis to one side and sentiment perked up. Friday’s solid US payrolls report provided the icing on the cake for a good week for risk.
Payrolls rose 175k, above the 149k expected, defying some of the bad weather effects from February. The private sector was the key driver of jobs growth, rising 162k last month, led by large gains in the business and service sectors. The weakest areas of job growth included retail trade and the information sector, where small numbers of jobs were shed last month.
The other bright spots in the report included an upward revision to the January report and a 0.4% monthly gain in average wages. The participation rate was stable, but the unemployment rate inched away from the Fed’s 6.5% threshold and rose to 6.7% from 6.6% in January. Overall, this payrolls report makes it likely that the Fed will stick to the current pace of its tapering programme, while it may consider changing its forward guidance as the unemployment rate continues to hover closely to the 6.5% threshold.
Markets don’t like uncertainty and since Fed policy seems fairly stable for now, this may be good news for risk assets. Although problem areas remain in the global economy (Will the Russian/Ukraine crisis spark up again triggering a jump in energy prices? Will the China slowdown continue?), the market seems happy to look on the bright side for now.
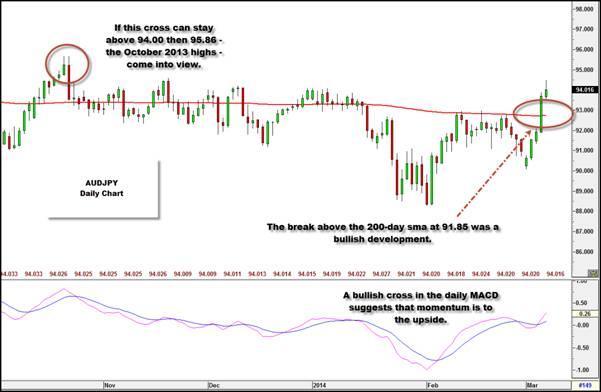
We appear to be in a sweet spot for the global economy, where growth is not too cold to spook investors and neither is it too hot to spark tighter monetary policy from the world’s largest central banks. While this sweet spot will not last forever, it could help stocks extend recent gains and boost risky FX as we start a new week. It could also weigh on the yen, which is considered a safe haven. AUDJPY, which is sometimes considered a proxy for risk, may continue to rally after breaking some key resistance last week at 91.85 – the 200-day sma. If this pair can sustain gains above 94.00 then 95.86 – the high from 22nd October last year and also a Fib level of resistance – comes back into view.
Figure 1:
Source: FOREX.com
Will the ECB continue to turn a blind eye to EUR strength?
The single currency rose to its highest level for 2.5 years at the end of last week after ECB President Mario Draghi surprised the markets and gave a fairly upbeat assessment of the US economy. This may be a signal that the ECB’s easing cycle, which began in October 2008, could be coming to an end. After all, the ECB staff forecasts for growth and inflation show GDP picking up this year to 1.5% and inflation returning to target around Q4 2016.
Although the ECB reiterated its pledge to keep interest rates low for a prolonged period, the ECB does not seem to think that any further accommodative measures are needed, especially now that Europe’s periphery seems to be on the mend. But the ECB may be more cautious in the coming months, as the rally in the EUR that was triggered by Draghi’s fairly upbeat message could be the biggest threat to growth going forward.
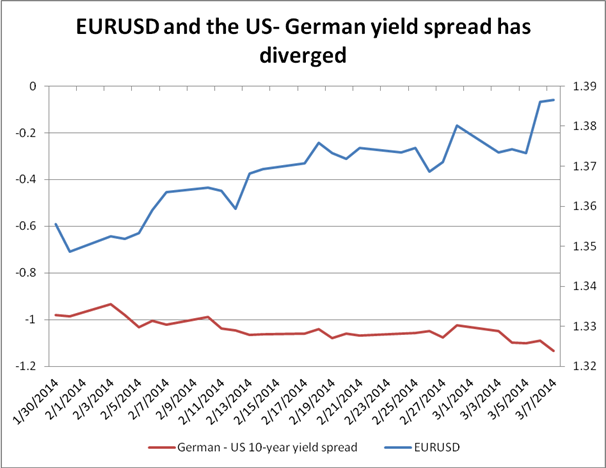
Since February, the EURUSD is up more than 3%, defying some expectations for a decline in the single currency. It seems that the ECB’s forward guidance is not necessarily working as a way to limit currency strength, which has been reflected in the breakdown between the German-US yield spread and EURUSD (see the chart below). Although Draghi seemed to play down the impact of the currency, saying that the ECB does not target FX as a policy tool, a strong EUR could limit further upside in the CPI, which could worry the ECB going forward as maintaining a stable inflation rate is the ECB’s only mandate.
While EURUSD backed away from 1.3915 highs at the end of last week, it still looks fairly comfortable above 1.3800, and life above 1.40 is still very much a possibility for this pair. However, if we do see further upside, then the risk of verbal intervention from the ECB to limit further EUR upside is increased, particularly if we see inflation weaken further. Therefore, EUR bulls need to watch out as the easy gains may have already been taken.
Figure 2:
Source: FOREX.com and Bloomberg
Market Movers: Weekly Technical Outlook
Technical Developments to Watch:
- EUR/USD at 2.5-year high, bias bullish above 1.3820
- GBP/USD still consolidating between 1.6600 and 1.6750
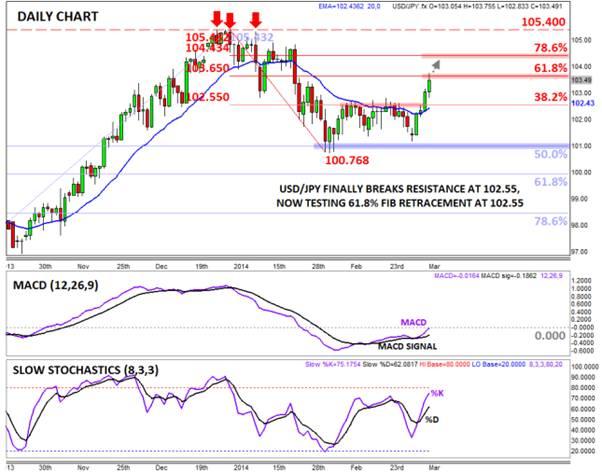
- USD/JPY finally breaks 102.55, now testing near-term resistance 103.65
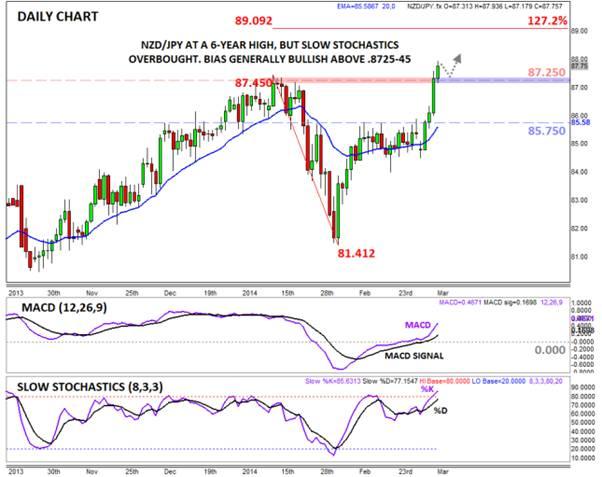
- NZD/JPY at 6-year highs, 87.25-45 should now provide support
EUR/USD
- · EUR/USD pulled back early before rocketing higher on Thursday
- · MACD still modestly bullish, Stochastics not yet overbought
- · Bias bullish above key 1.3825 level
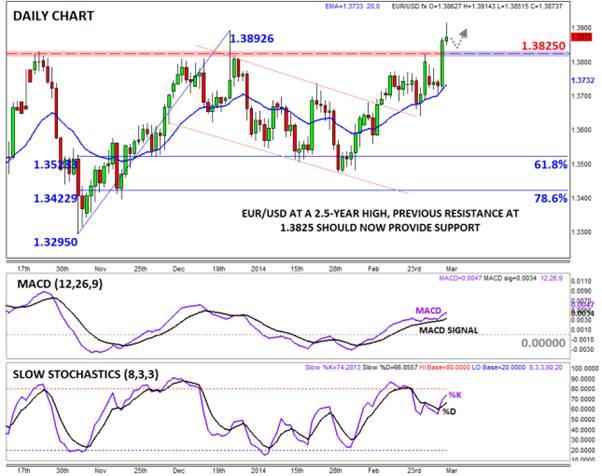
The EUR/USD initially inched lower to start last week, but then rates exploded higher on less dovish comments by ECB President Draghi on Thursday. From a technical perspective, the EUR/USD is trading above strong previous resistance around the 1.3825-30 level as of writing Friday afternoon. The secondary indicators are also generally bullish, with the MACD trending higher above its signal line and the “0” level and the Slow Stochastics not yet in overbought territory. For this week, the bias for the pair remains to the topside as long as rates hold above the 1.3825 level; although, as we noted on twitter Thursday, there are some longer-term levels of resistance in this area to be aware of.
Figure 3:
Source: FOREX.com
GBP/USD
- GBP/USD consolidated below 1.6750 last week
- MACD and Slow Stochastics indicate balanced, two-way trade
- Bias neutral between 1.6600 and 1.6750, but breakout would be bullish
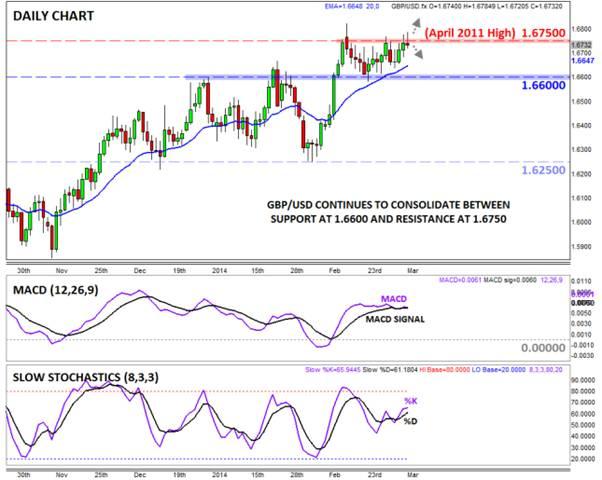
The GBP/USD primarily consolidated last week as the Bank of England remained on hold and traders digested mixed US data. As we noted last week, the recent consolidation has given the 20-day EMA time to “catch up” with prices, providing support in the lower 1.6600s. Meanwhile, the secondary indicators are neutral, with both the MACD and Slow Stochastics moving sideways in the middle of the recent ranges. Heading into this week, our bias on the pair is neutral between 1.6600 and 1.6750, though a breakout from this range may foreshadow a continuation in the same direction for the rest of the week.
Figure 4:
Source: FOREX.com
USD/JPY
- · USD/JPY finally breaks 1.0255 resistance
- · MACD turning higher, about to cross the “0” level
- · Testing Fib resistance at 103.65, break above could expose 104.00/40 next
USD/JPY traders were finally able to shake themselves out of their stupor last week, with rates rallying up through strong previous Fibonacci retracement resistance around 102.55. The pair had peeked above this level nine separate times in February, but finally was able to “seal the deal” with a close above it on Thursday. The secondary indicators are modestly supportive, with the MACD trending higher back toward the “0” level and the Slow Stochastics not yet in overbought territory. For this week, the technical signs are pointing to the potential for more gains, but fundamental data releases will also have a big impact (see the “Data Highlights” section below for more).
Figure 5:
Source: FOREX.com
NZD/JPY
- · NZD/JPY exploded to a new 6-year high last week
- · MACD bullish, though Slow Stochastics now overbought
- · Bias bullish above previous-resistance-turned-support in the 87.25-45 zone
The NZD/JPY is our currency pair in play this week due to a number of major data releases, including central bank meetings from both the RBNZ and BOJ, along with a raft of high-impact Chinese data (see “Data Highlights” below for more on these reports). From a technical perspective, the NZD/JPY had a stellar week, rising nearly 350 pips from Monday’s low to break out to a new 6-year high above .8745 as of writing. The MACD shows growing bullish momentum to support this move, though the Slow Stochastics have no risen into overbought territory. For this week, fundamental data will play a big factor, but the technical bias will remain to the topside as long as previous-resistance-turned-support in the 87.25-45 zone puts a floor under prices.
Figure 6:
Source: FOREX.com
Weekly outlook: Stocks
The US jobs report for the month of February, released on Friday, provided all the right ingredients for the stock market rally – or at least that was the initial response, as the S&P 500 hit a fresh all-time high. The headline nonfarm payrolls number of 175,000 was better than expected while the previous month’s figure was revised up slightly. What’s more, although the unemployment rate surprisingly edged higher to 6.7% from 6.6%, this was seen as positive for stocks as it could discourage the Fed from speeding up the QE reduction process.
The prospects for a brighter economic outlook, combined with extended periods of record-low interest rates and stable inflation, is what’s keeping stocks elevated. Who would have thought on 9th March 2009 – or even years after – that a major stock market rally would have taken place? By Sunday this rally will have turned 5 years old and there are few signs to suggest it will end soon. Having said that, there is always the risk of some unexpected event occurring (such as a natural disaster, a major terrorist attack or Russia invading Ukraine, to name but a few) which could send stocks tumbling. So, a degree of caution is recommended, especially as the S&P is currently floating through unchartered territories. There are also concerns over China, where the risks of a “soft landing” or a housing market bubble bursting remain real. As such, it will be prudent to watch out for a raft of data coming out of the world’s second largest economy over the next several days, starting with trade and CPI figures over the weekend. These will be followed by industrial production and a bunch of other releases on Thursday. We will also have the Bank of Japan policy decision, as well as some important data out of the US, such as retail sales and consumer sentiment, next week.
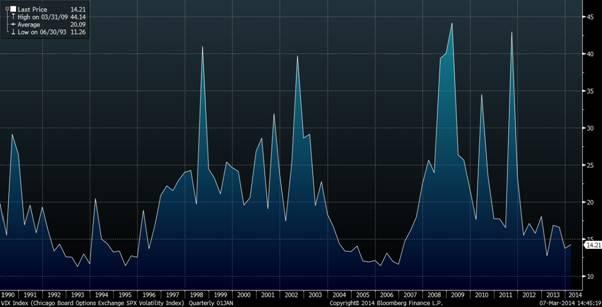
So there’s plenty of scope for some near-term volatility next week. Speaking of volatility, the VIX, at 14.20, remains well below its average of around 20.00. This suggests two things. First, it appears that investors do not foresee the danger of a sharp pullback in the near term. Second, complacency may be running high. This may be a warning sign because markets sometimes top unexpectedly and for no apparent reason – that is, they collapse under their own weight as more and more investors take profit.
Figure 7:
(Source: Bloomberg, FOREX.com)
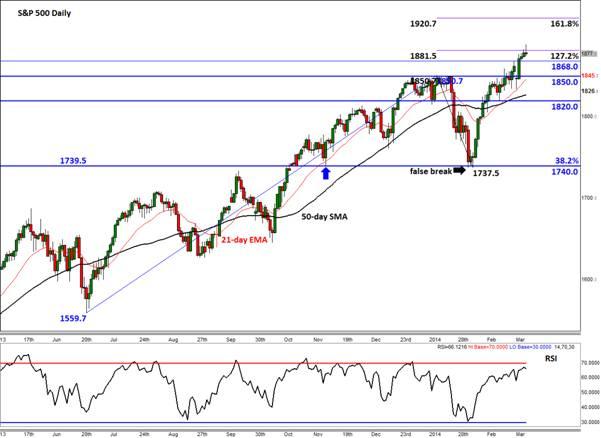
On the technical front, the sell-off at the start of the year only managed a relatively shallow 38.2% Fibonacci retracement as can be seen on the daily chart, below. This suggests that the next leg of the rally could potentially be quite significant as most existing buyers are likely to have remained in the game following that rout. What’s more, traders who prefer to buy on break outs may have again joined the rally, now that we have cleared the old resistance level of 1850. As the S&P 500 is hovering at unchartered territories, there are no ‘price’ reference points to watch out for on the upside. As such, Fibonacci extension levels are among the obvious factors worth keeping an eye on as they could offer resistance. The next two main extension levels (i.e. 127.2 and 161.8 percent) are at 1881/2 and 1920/1 respectively. We have already reached the first target this week, but given that shallow pullback earlier this year, I wouldn’t be surprised if we were to reach the latter fairly quickly too – or surpass it, for that matter. The near-term support levels to watch are at 1868, 1850 and then 1820 – levels that were formerly resistance.
Figure 8:
Source: FOREX.com. Please note this product is not available to US clients
Weekly outlook: Commodities
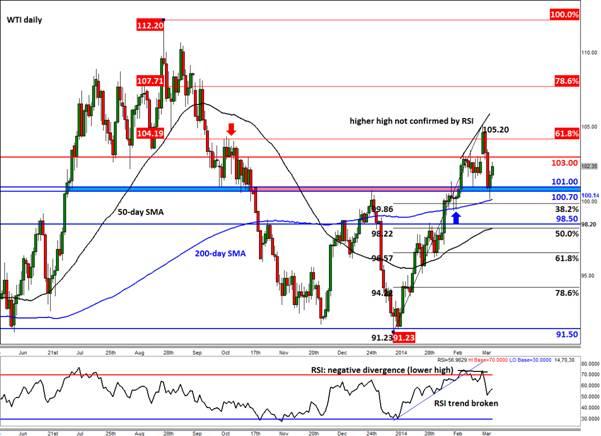
It was all about Ukraine this week. Crude oil prices initially jumped at open on Monday as traders responded to news that Russia seized control of the Crimea peninsula and President Vladimir Putin threatened to fully invade the country. But prices then sold off after Putin downplayed those fears. Towards the end of the week however, the tensions were renewed once again which caused oil prices to bounce off their lows. Meanwhile, the el Shara oilfield in Libya remained shut and that prevented Brent oil prices from sliding further. In the US, there was a larger-than-expected build in crude stocks while distillate inventories also rose unexpectedly. The increase in distillate stocks suggests demand for heating may have already started to fall, and the trend may continue as the weather improves. But destocking in Cushing, Oklahoma, where the WTI contract is priced, continued once again. This was another factor keeping a floor under prices.
Going into the new week, it is well worth staying up to date with the developments in Ukraine, while also keeping a close eye on the Chinese and US macroeconomic data. For details, please refer to our Data Highlights section below. Until and unless the situation in Ukraine is fully resolved, oil prices are unlikely to fall significantly. Indeed, the technicals point towards some near-term gains after the US oil contact managed to hold its own above the 200-day moving average ($100.15) and also the $107.70/$101.00 support range. Unless it takes out the 200-day SMA, preferably on a daily closing basis, the trend would thus remain bullish. Having said that, WTI has already formed a negative divergence whereby its move higher was not supported by a corresponding rise in the RSI, which in fact created a lower high. This suggests the rally may be stalling, although we have seen some sharp losses already. The near-term resistance levels to keep an eye on next week are $103, $104.20 and $105.20. A potential break above $105.20 would be a particularly bullish development.
Figure 9:
Source: FOREX.com. Please note this product is not available to US clients
Data Highlights
Monday, March 10, 2014
12:15 GMT Canadian Housing Starts
- Housing starts in Canada have declined each of the last three months in addition to missing consensus, but not so strongly that it has put the Bank of Canada on alert. In fact, the BoC mentioned in their most recent monetary policy statement that “recent data supports the Bank’s expectation of a soft landing in the housing market.” So despite the worsening of data in this sector, concern is still lackluster unless a result that is extremely bad is experienced. Therefore, even if this result misses expectations again, it may not have an overwhelming negative effect.
Tuesday, March 11, 2014
3:00 GMT Bank of Japan Interest Rate Decision and Monetary Policy Statement
- This will be the final meeting of the BoJ before the infamous sales tax hike will go into effect in Japan, raising the tax from 5% to 8%. The overall impact of this increase is still unknown and due to that fact, the BoJ may be more inclined to sit on the sidelines and be more reactive than proactive especially considering they extended special loan programs last month.
9:30 GMT UK Industrial and Manufacturing Productions
- The production sector is expected to produce some mild growth at the start of the year; however, production could have been impacted by weather effects. Although survey data like the manufacturing PMI suggest a pick-up in growth the surveys have tended to overstate the hard data. Overall, a number weaker than expected could weigh on GBP.
9:30 GMT Bank of England Members Testify before Treasury Select Committee
- The suspension of a BOE employee over concerns about manipulation in the FX market is likely to be high on the agenda which could limit the amount of time he gets to talk about policy. However, if he does stick to the same message from the inflation report, we could see a short-term rally in the pound.
15:00 GMT US Wholesale Inventories
- Weather has been the “go-to” excuse for much of the last three months as US data has had the propensity to miss expectations during that time. Wholesale Inventories in particular increased two of those three months, which is not a good thing. While some economic figures, like consumer confidence, have been able to rebound, others have been more stubborn. If this release fails to show a good result, weather will most likely be blamed once again.
Wednesday, March 12, 2014
9:30 GMT UK Trade Balance
- The overall deficit is expected to widen to GBP 2.2bn after the December deficit actually contracted. Although the recovery in exports may have slowed at the start of the year, they are expected to pick up again later this year.
10:00 GMT Eurozone Industrial Production
- This is expected to rise in January by 0.5%, partly reversing the 0.7% decline in December, although the underlying trend is likely to remain sluggish. German industrial production rose by 0.8% at the start of the year and there are signs that production could have risen in France, Italy and Spain. The manufacturing PMI suggests the recovery in production is on-going although progress is very slow.
21:00 GMT Reserve Bank of New Zealand Interest Rate Decision and Press Conference
- The RBNZ mentioned at their decision in January that they expect to return interest rates to more normal levels “soon,” which hasn’t done much in the way of forward guidance. Since that time their employment improved, the Trade Balance was stronger than expected, Business Confidence increased and even Credit Card Spending jumped. However, the quarterly read on Retail Sales failed to live up to expectations. Since the last decision though, the NZD/USD has risen from the sub-0.81’s to almost 0.85 as investors have been less concerned about the Emerging Market crisis and more confident in a NZ recovery and the hawkish monetary policy that may follow in its footsteps.
Thursday, March 13, 2014
0:30 GMT Australian Employment Change and Unemployment Rate
- This past week, Australia has been the darling of the currency world as report after report showed that the Reserve Bank of Australia may have made the right call by shifting more toward a neutral stance instead of a dovish one. In very quick succession GDP, Retail Sales, and Trade Balance all indicated that the Australian economy was doing just fine. Before we light the fireworks for the Aussie recovery party though, Employment also needs to rebound for investors to pile back on the bandwagon. Employment has disappointed six out of the last seven months, falling negative in four of those months. If Employment can rebound strongly, the AUD may resemble a lit firework as it rises against its foes.
2:00 GMT Chinese Industrial Production
- Despite two straight months of decline in this variable, it is still very strong and shows the resiliency of the Chinese economy. The danger with this report though is if it declines more than expected. Chinese growth has become a bit of a question mark after HSBC PMI figures have shown contraction in the manufacturing sector. If Industrial Production fails to reach consensus, concerns over a slowdown in China could get more serious.
13:30 GMT US Retail Sales
- Adding to the list of weather-affected results in the US have been Retail Sales. Last month’s disappointing 0.4% decrease is a prime example of how weather is keeping people from spending like they normally would, particularly if you consider how Consumer Confidence has been surprisingly resilient. That gives this figure the chance for a strong rebound especially considering the stronger than expected Non-Farm Payroll report released this past week.
17:00 GMT European Central Bank President Mario Draghi’s Speech in Vienna
- We doubt that he will diverge from his press conference last week, but watch out for any signs that the ECB president is concerned about the strength of the EUR (see ECB section for more on this.)
Friday, March 14, 2014
10:00 GMT Eurozone Employment Change
- This is expected to support the view that the Eurozone labour market is starting to recover and there could have been a net increase in jobs in Q3 2013 for the first time since Q2 2011. Survey measures of hiring, including the PMI data, suggest that job creation could continue at the start of 2014.
11:00 GMT Preliminary UM/Reuters Consumer Sentiment for the US
- Speaking of resilient Consumer Sentiment indicators, the UM Reuters report has been at the head of the table of that discussion. Two out of the last three months the Preliminary read has been higher than expectations despite the thought that the winter blues would hamper sentiment. If this trend can be extended, the US recovery from weather related depression could become less of a theory and more of a reality.
General Risk Warning for stocks, cryptocurrencies, ETP, FX & CFD Trading. Investment assets are leveraged products. Trading related to foreign exchange, commodities, financial indices, stocks, ETP, cryptocurrencies, and other underlying variables carry a high level of risk and can result in the loss of all of your investment. As such, variable investments may not be appropriate for all investors. You should not invest money that you cannot afford to lose. Before deciding to trade, you should become aware of all the risks associated with trading, and seek advice from an independent and suitably licensed financial advisor. Under no circumstances shall Witbrew LLC and associates have any liability to any person or entity for (a) any loss or damage in whole or part caused by, resulting from, or relating to any transactions related to investment trading or (b) any direct, indirect, special, consequential or incidental damages whatsoever.
Recommended Content
Editors’ Picks
EUR/USD alternates gains with losses near 1.0720 post-US PCE

The bullish tone in the Greenback motivates EUR/USD to maintain its daily range in the low 1.070s in the wake of firmer-than-estimated US inflation data measured by the PCE.
GBP/USD consolidates above 1.2500, eyes on US PCE data

GBP/USD fluctuates at around 1.2500 in the European session on Friday following the three-day rebound. The PCE inflation data for March will be watched closely by market participants later in the day.
Gold clings to modest daily gains at around $2,350

Gold stays in positive territory at around $2,350 after closing in positive territory on Thursday. The benchmark 10-year US Treasury bond yield edges lower ahead of US PCE Price Index data, allowing XAU/USD to stretch higher.
Bitcoin Weekly Forecast: BTC’s next breakout could propel it to $80,000 Premium

Bitcoin’s recent price consolidation could be nearing its end as technical indicators and on-chain metrics suggest a potential upward breakout. However, this move would not be straightforward and could punish impatient investors.
Week ahead – Hawkish risk as Fed and NFP on tap, Eurozone data eyed too

Fed meets on Wednesday as US inflation stays elevated. Will Friday’s jobs report bring relief or more angst for the markets? Eurozone flash GDP and CPI numbers in focus for the Euro.
