With all the chatter about whether the Fed will hike on September 17 or not, let's do an interest rate and bond yield recap of where various rates are, where they have been, and where they are likely headed.
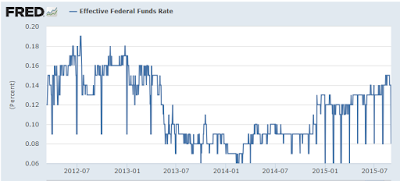
Effective Federal Funds Rate
As of yesterday, the effective federal funds rate was a mere 8 basis points. Since April, it has been swinging from a low of 6-8 basis points to a high of 14-15 basis points.
I suspect the odds of a hike are close to 50-50.
The CME Fed Watch has the hike odds at 27% as of September 2. However, the CME does not consider a move to 0.25% a hike.
I do, because it clearly is.
The current Fed stance is 0.00% to 0.25%. With the effective Fed Funds rate hovering between 8 and 15 basis points, a move to a firm 0.25% would be about an eighth of a point hike.
Why nearly everyone expects a quarter point hike is a pure mystery to me.
If the Fed delays until December, we may see such a move (if the economy stays reasonably firm), but even then, I believe the Fed will baby-step this in a Market May I approach, quite similar to the childhood "Mother May I" game.
Yellen vs. Greenspan
Recall Greenspan's famous statement: Hikes will be at a "pace that's likely to be measured".
The Yellen expected "pace" is half as often.
The Yellen expected "measure" is half as much.
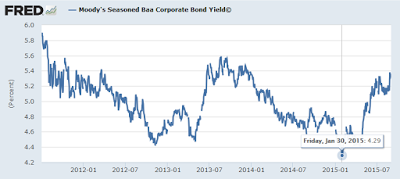
Moody's Seasoned Baa Bond Yield Detail
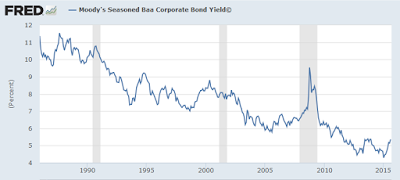
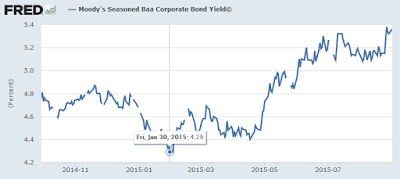
Baa is Moody's lowest investment grade bond (one step above junk). It is a measure of risk taking appetite. The rise in yield from January is an effective tightening of rates, albeit from a low level. The following long term chart adds perspective.
Moody's Seasoned Baa Bond Yield
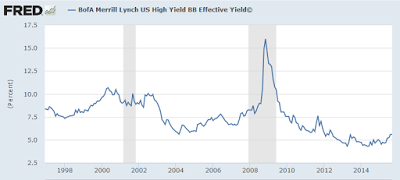
BB High Yield Bond Yield
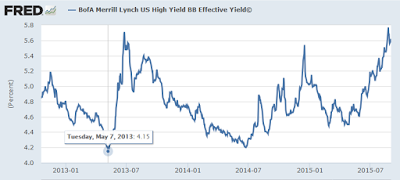
BB is the top junk bond rating. Is the yield bottom in?
10-Year Breakeven Rate
Financial Times provides this Definition of Breakeven Rate.
The Break-even rate refers to the difference between the yield on a nominal fixed-rate bond and the real yield on an inflation-linked bond (such as a Treasury inflation-protected security, or Tips) of similar maturity and credit quality. If inflation averages more than the break-even rate, the inflation-linked investment will outperform the fixed-rate bond. If inflation averages below the break-even rate, the fixed-rate bond will outperform the inflation-linked bond.
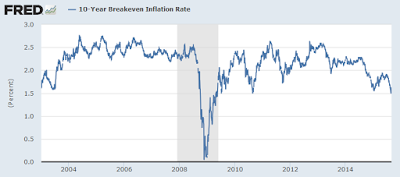
The 10-year breakeven rate is about 1.63% as of August 31, 2015. Clearly the market is not expecting serious consumer price inflation for quite a long time.
Yield Curve as of 2015-09-01
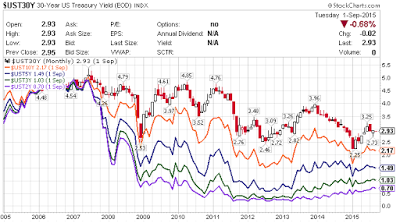
I created the above chart in Stock Charts. The chart shows US treasury yields from 2 years to 30 years.
2- and 3-year yields have been rising very slowly since the beginning of 2013 in anticipation of Fed rate hikes.
At the long end of the curve (30-year in red, 10-year in orange) rates made recent highs in late 2013 but are well below those highs now.
Let's compare rates across the entire curve now compared to a year ago.
US Treasury Yields Now vs. Year Ago
Thanks to Doug Short at Advisor Perspectives for help with the above chart.
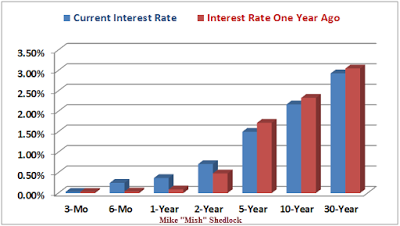
Note that between 6-months and 2-years, treasury yields are higher than they were a year ago. Meanwhile, from 5-years and out, rates are lower than they were a year ago.
September Hike Ideal?
Torsten Slok, Deutsche Bank's chief U.S. economist, sees a silver lining in this market turmoil that he figures actually makes a September liftoff look more attractive.
"If anything, the narrative in markets at the moment is such that if the Fed does hike in September, then long rates and the dollar will decline because the market will think the Fed is hiking prematurely," Slok says in a research note. "Ironically, September may be the ideal time for the Fed to hike rates because given the way we currently talk about the economy in markets a Fed hike in September will likely be associated with an easing of financial conditions and not a tightening."
He asserts that the central bank ought to "do the first hike exactly when there is a bearish narrative in markets" to ensure it doesn't prompt yields further out along the curve to jump, as was the case in the infamous bond selloff sparked by 1994's rate rise.
The Bloomberg article also mentions the "savings glut" thesis, a preposterous idea that I will rebut, in detail, later, in a separate post.
Mish Rebuttal of Slok's View
Other than general agreement over the unlikelihood of the long end spiking, Slok's reasoning seems flat out wrong.
The flattening of the curve is generally not good for bank profits and also reflects increasing recession possibilities.
A key reason the yield curve cannot invert now is the low end is at zero. Price in a couple hikes and portions of the yield curve could invert.
That's what happened in Canada earlier this year following a surprise cut in rates by the Royal Bank of Canada.
Canada Recession
On January 31, Based on an inversion in parts of the yield curve, I correctly proclaimed Canada in Recession.
Just yesterday, Canadian stats confirmed the recession. It remains to be seen if the US follows, but a flattening of the yield curve is not a good sign for growth.
How Big a Hike?
The debate still rages "will they, won't they". The correct answer is "It won't matter at all".
If the US does follow into recession, rest assured it will not be because of hike. With the global economy slowing rapidly, and with US equities and corporate bonds in huge bubbles, one hell of a payback is coming for the inane QE policies of this Fed.
Bubbles of Increasing Amplitude
Some defend the Fed, but I don't.
Fed policy is also behind rising income inequality that Fed Chair Janet Yellen constantly whines about.
Is the Bond Bull Market Over?
Here's the question that's been on nearly everyone's mind for at least a decade: Is the Bond Bull Market Over.
I have two answers: Yes, and Perhaps Not.
Those answers are not contradictory. There are many bond bull markets to consider. Let's start with corporate bonds.
Near-Junk Corporate Bull Market Over?
Using Moody's Baa seasoned bonds as a good proxy for near-junk (the lowest investment grade bonds), let's take an even closer look at recent happenings.
The Moody's Baa seasoned bond yield hit an all-time low of 4.29% on January 30, 2015. It is now 5.36%. That's over a 100 basis point tightening (one full percentage point) in a mere seven months.
I am willing to state that the bull market in near-junk bonds is finished.
At some point the market will question covenant-lite conditions in which corporations can pay back debt with more debt issuance.
At some point the market will questions corporations taking on debt to buy back shares.
At some point the market will question the ability of some of these near-junk companies to survive at all.
At some point the market will realize what a bubble the Fed has blown with QE and how it seriously affected junk bond rates.
That "some point" appears to be now.
The only question is how fast the air comes out of the enormous junk balloon. We have yet seen a slow release of air from a bubble. Will this be a first?
Junk Bond Bull Market Over?
Let's hone in on BB bonds, the top-tier on non-investment grade (junk) bonds.
In April of 2013, the BofA Merrill Lynch US High Yield BB Effective Yield© hit an all-time low yield of 4.31%. The effective yield is now 5.62%.
That is a rise of 131 basis points (1.31 percentage points).
And for the same reasons noted in the above Baa discussion, I declare the end of the junk bond bull market.
Is the US Treasury Bull Market Over?
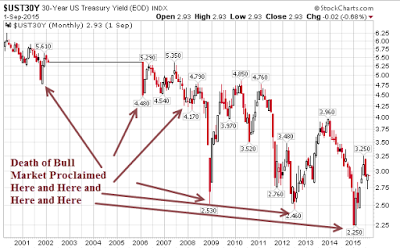
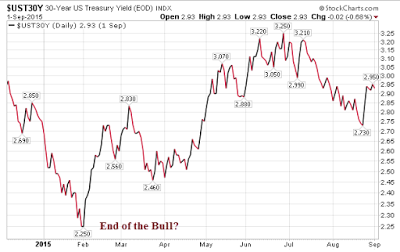
This question is amusing. Here is a pair of charts that shows why.
US 30-Year Bond Yield Monthly Chart
The "death" of the US treasury bull market has been proclaimed so many times it's difficult to show them all. Let's hone in further.
US 30-Year Bond Yield Daily Chart
Where others saw massive price inflation coming (with the CPI as the determining measure), I called for deflation (as measured by credit marked to market and asset prices). In other words I expected monetary inflation to manifest itself in asset prices not consumer prices.
I stick with that call. For all of those who think consumer price inflation is just around the corner, I have some questions.
Questions for Inflationistas
What happens when there is another asset bubble bust in the US?
What happens if the US goes into recession later this year or early 2016?
What happens to the long end of the curve if the market even thinks the Fed will hike the US into recession?
What is happening to the long end of the cure relative to the short end?
Do consumer prices soar when commodity prices collapse?
Bonus question: With the long end of the curve just 70 basis points away from a record low, and with a global growth slowing, is it inconceivable for another record low at the long end of the curve?
Is the Bond Bull Market Over?
US Corporates: Yes - and with surprisingly little fanfare
US Treasuries: Maybe - but with constant speculation and erroneous proclamations for what seems like forever.
By the way, junk bond bull markets and equity bull markets tend to go hand-in-hand. So do junk bond bear markets and equity bear markets.
This material is based upon information that Sitka Pacific Capital Management considers reliable and endeavors to keep current, Sitka Pacific Capital Management does not assure that this material is accurate, current or complete, and it should not be relied upon as such.
Recommended Content
Editors’ Picks
EUR/USD edges lower toward 1.0700 post-US PCE

EUR/USD stays under modest bearish pressure but manages to hold above 1.0700 in the American session on Friday. The US Dollar (USD) gathers strength against its rivals after the stronger-than-forecast PCE inflation data, not allowing the pair to gain traction.
GBP/USD retreats to 1.2500 on renewed USD strength

GBP/USD lost its traction and turned negative on the day near 1.2500. Following the stronger-than-expected PCE inflation readings from the US, the USD stays resilient and makes it difficult for the pair to gather recovery momentum.
Gold struggles to hold above $2,350 following US inflation

Gold turned south and declined toward $2,340, erasing a large portion of its daily gains, as the USD benefited from PCE inflation data. The benchmark 10-year US yield, however, stays in negative territory and helps XAU/USD limit its losses.
Bitcoin Weekly Forecast: BTC’s next breakout could propel it to $80,000 Premium

Bitcoin’s recent price consolidation could be nearing its end as technical indicators and on-chain metrics suggest a potential upward breakout. However, this move would not be straightforward and could punish impatient investors.
Week ahead – Hawkish risk as Fed and NFP on tap, Eurozone data eyed too

Fed meets on Wednesday as US inflation stays elevated. Will Friday’s jobs report bring relief or more angst for the markets? Eurozone flash GDP and CPI numbers in focus for the Euro.
