![]()
Highlights
- Market Movers: Weekly Technical Outlook
- ECB: From Jackson Hole to Frankfurt, a World of Difference
- Does the Divergence of the S&P 500 and Treasury Yields Pose a Threat to Equities?
- Global Data Highlights
Market Movers: Weekly Technical Outlook
Technical Developments to Watch:
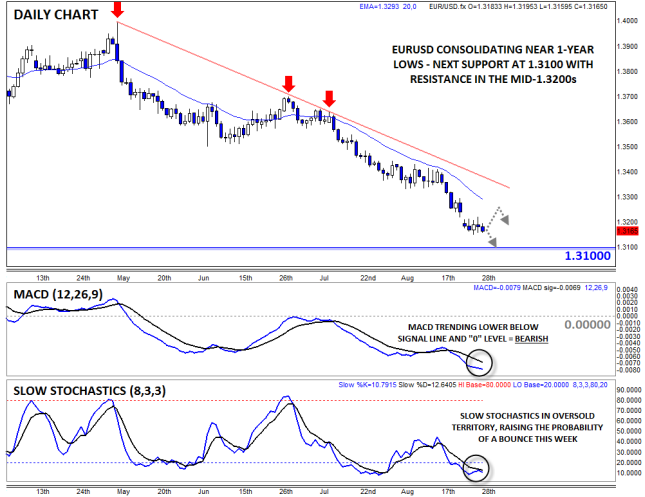
- EUR/USD consolidating in a tight range at 1-year lows ahead of ECB
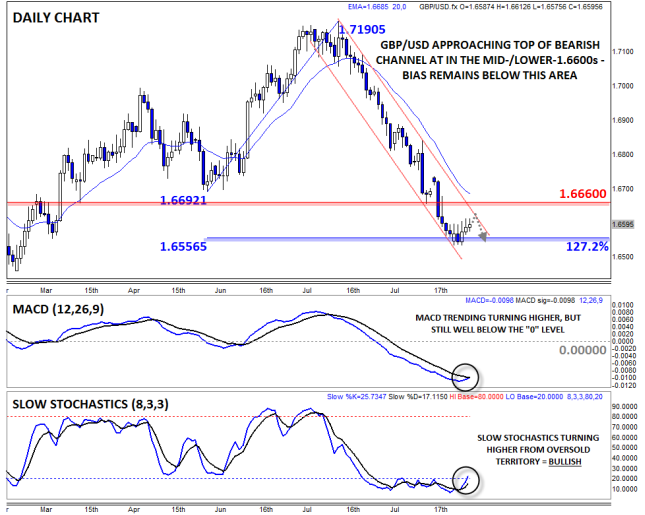
- GBP/USD nearing top of 2-month bearish channel near 1.6630
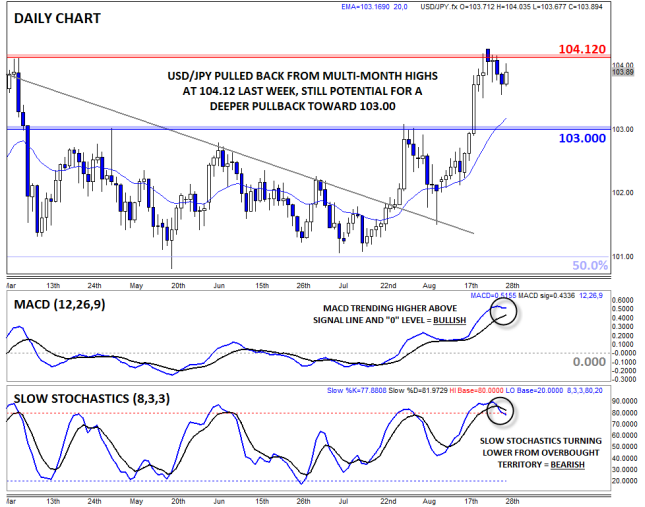
- USD/JPY rally stalled at 104.12 resistance, but support remains near 103.00
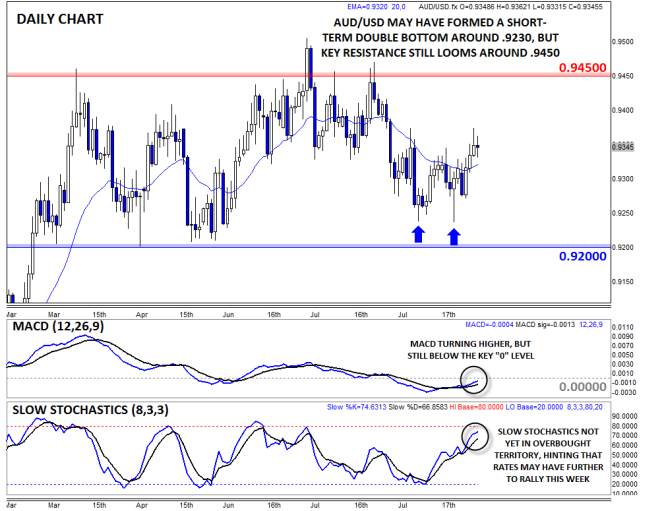
- AUD/USD in play, rates still trapped in .9200-.9450 range
EUR/USD
- EUR/USD stabilized in the mid-1.3100s after gapping to new 1-year lows last week
- MACD shows bearish momentum, but Slow Stochastics now in oversold territory
- Chance for an oversold bounce remains, but rallies likely to be short-lived toward 1.3250-1.3300
The EURUSD gapped to a new one-year low under 1.3200 to start last week, but rates merely consolidated in a tight range from there. The outlook for this week is similar to our outlook from the previous few weeks: the downtrend remains strong, as shown by the continually falling MACD, but the Slow Stochastics are in oversold territory, raising the risk of an oversold bounce this week. Conservative traders may look to fade any bounces into resistance at the 20-day EMA near 1.3250 and bearish trend line around 1.3300.
Source: FOREX.com
GBP/USD
- GBP/USD held its ground in the mid-1.6500s last week
- Slow Stochastics is turning higher from oversold territory
- Previous-support-turned-resistance at 1.6660 may still cap near-term rallies
The GBPUSD had a rather lackluster week, but after the strong selling pressure over the past few months, bulls will take anything they can get. The pair inched higher off minor support at the 127.2% Fibonacci extension of the June-July upswing at 1.6550, potentially opening the door for a small recovery this week. The MACD remains below the “0” level, but the Slow Stochastics have started to turn higher from oversold territory, suggesting a larger bounce may be in the cards. Any rallies that do emerge could be capped by the top of the bearish channel and previous-resistance-turned-support near 1.6660; only a break through that level would shift the medium-term bias to the topside.
Source: FOREX.com
USD/JPY
- USDJPY rally stalled out against 104.12 resistance last week
- Slow Stochastics rolling over from overbought territory
- Still potential for a pullback to the 20-day EMA and 103.00 handle before buyers emerge
The USDJPY gapped up to a multi-month high at 104.25 to start last week, but gradually inched lower from there. At this point, the pair’s MACD remains above its signal line and the “0” level, but the Slow Stochastics are rolling over from overbought territory, supporting the case for a near-term pullback. The longer-term monetary policies of the US and Japan still favor a higher USDJPY in time, but the near-term technical picture suggests we may see a near-term pullback first.
Source: FOREX.com
AUD/USD
- AUDUSD traded higher last week, reaching a 3-week high in the mid-.9300s
- Both the MACD and Slow Stochastics indicate an improving technical picture
- Potential for rates to move toward the top of the recent range near .9450 from here
The AUD/USD is our currency pair in play due to a number of high-impact economic reports out of Australia and the U.S. this week (see “Data Highlights” below for more). From a technical perspective, the pair ticked higher this week, reaching a three-week high above 0.9350. In the near term, rates may have completed a double bottom formation at 0.9240, opening the door for further gains toward the top of the recent range at 0.9450. Looking to the secondary indicators, the MACD has turned higher and is about to cross the “0” level, while the Slow Stochastics indicator has yet to reach overbought territory, hinting that the pair may have further to run. For this week, the short-term bias is to the topside for a possible move toward 0.9450, especially if Australian fundamental data comes out favorable.
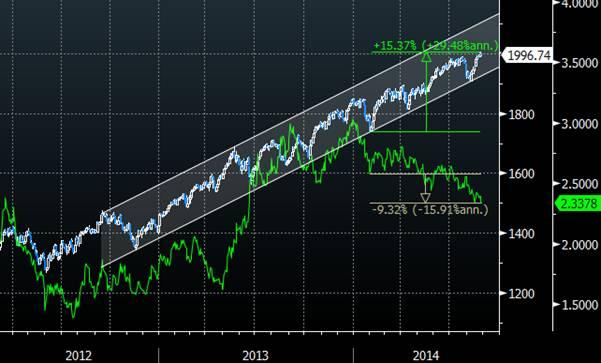
The S&P 500 closed above 2,000 for the first time ever last week, before succumbing to soft investor sentiment later in the week on the back of increased geopolitical tension. As we outlined last week, the fundamental outlook for US equities is fairly strong, with investors seemingly embracing the prospect of higher rates. However, a divergence between the S&P 500, both on a P/E ratio basis and the index as a whole, and U.S. Treasury yields is raising some alarm bells.
As is evident from the graph below, the wedge between the S&P 500 and bond yields formed in Q2 and has since grown immensely. Typically, risk sentiment dictates that these two have a somewhat linear relationship, with yields and equities rising in times of positive investor sentiment and falling when the market becomes risk adverse. Equities are generally seen as a risky asset class, while U.S. Treasuries are perceived as the ultimate safe-haven assets. Therefore, a divergence between yields and stocks can be a red flag for investors.
At the beginning of the year it was widely believed that yields would spike as the US economy recovered and the Fed’s tightening plan became more obvious, but while the latter factors have occurred, yields are continue to head lower. The two primary reasons for this are heightened geopolitical tension and increased foreign demand as the prospect of further monetary easing in Europe and Japan becomes more likely. At the same time, perceptions on when the Fed will finish tapering its asset purchases and begin to hike interest rates haven’t changed a great deal.
In US equity markets, investors have been emboldened by strong earnings and a continuing US economic recovery. The markets have largely brushed aside increased geopolitical tensions and the prospect of rising interest rates. The biggest differentiating factor between the two asset classes, then, is their opposite reactions to geopolitical risk. This should be slightly concerning for investors, but may not discourage the bulls at this stage. The risk is that a further escalation of tensions in the Middle East and/or Ukraine creates a risk-adverse market.
Overall, the divergence of the S&P 500 and US yields can largely be quantified, thus it doesn’t point to an imminent correction for either asset class. The biggest threat to this theory will come from US economic data and the notion of when the Fed will begin rising interest rates. If expectations change dramatically, the void between the two may quickly snap shut, which may involve a sell-off in the S&P 500 if investors are spooked by the prospect of higher rates sooner rather than later.
S&P 500 (white) and U.S. 10-year Treasury Yield:
Recommended Content
Editors’ Picks
EUR/USD edges lower toward 1.0700 post-US PCE

EUR/USD stays under modest bearish pressure but manages to hold above 1.0700 in the American session on Friday. The US Dollar (USD) gathers strength against its rivals after the stronger-than-forecast PCE inflation data, not allowing the pair to gain traction.
GBP/USD retreats to 1.2500 on renewed USD strength

GBP/USD lost its traction and turned negative on the day near 1.2500. Following the stronger-than-expected PCE inflation readings from the US, the USD stays resilient and makes it difficult for the pair to gather recovery momentum.
Gold struggles to hold above $2,350 following US inflation

Gold turned south and declined toward $2,340, erasing a large portion of its daily gains, as the USD benefited from PCE inflation data. The benchmark 10-year US yield, however, stays in negative territory and helps XAU/USD limit its losses.
Bitcoin Weekly Forecast: BTC’s next breakout could propel it to $80,000 Premium

Bitcoin’s recent price consolidation could be nearing its end as technical indicators and on-chain metrics suggest a potential upward breakout. However, this move would not be straightforward and could punish impatient investors.
Week ahead – Hawkish risk as Fed and NFP on tap, Eurozone data eyed too

Fed meets on Wednesday as US inflation stays elevated. Will Friday’s jobs report bring relief or more angst for the markets? Eurozone flash GDP and CPI numbers in focus for the Euro.
