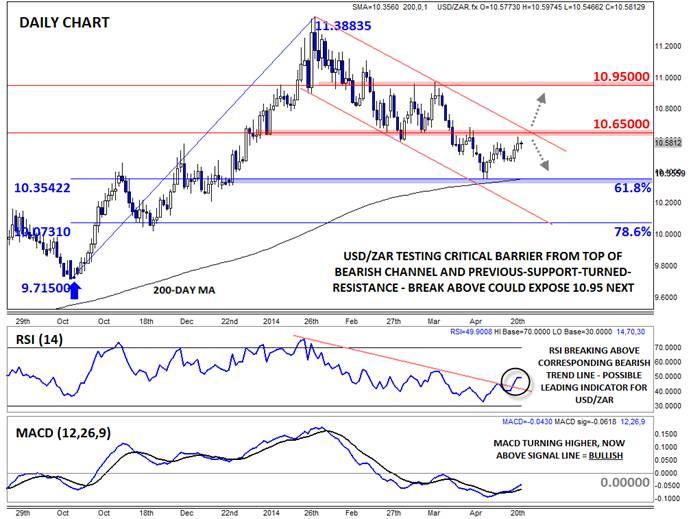
Two weeks ago, we highlighted the potential for a bottom to form near 10.35 on USD/ZAR (see “USD/ZAR: Could This Be a Near-Term Bottom?†for more). As it turned out, the pair did find floor near the highlighted level, and rates have since rallied back up to test the 10.60 level. That said, a much more important technical test looms before traders can shift back to an outright bullish bias.
Yesterday, investors got their first glance at March inflation data in the Rainbow Nation. The headline CPI figure came in at 1.3% m/m, higher than the 1.1% that traders and economists were expecting. The unexpected rise in prices was driven primarily by increases in the cost of food and fuel, which are typically seen as temporary fluctuations, so the SARB may decide to hold off from raising interest rates at its meeting next month, though most analysts expect a hike at some point this year.
Looking to the daily chart, the USD/ZAR has bounced, but rates are now approaching a critical test of resistance near the convergence of the bearish channel off the late January high and previous-support-turned-resistance at 10.65. Given the repeated false dawns that USD/ZAR bulls have seen over the past few months, bulls are treating the recent bounce with skepticism.
That said, the secondary indicators suggest that the character of this bounce may be different than previous rallies. For one, the RSI indicator has broken above its corresponding bearish trend line, potentially leading a breakout in the price of the USD/ZAR itself. In addition, the MACD has turned higher and crossed above its signal line, showing declining selling momentum, if not an outright shift to new buying momentum in the market.
Despite these signs, conservative traders may still want to wait for a conclusive break above the bearish channel and 10.65 before taking new buy trades. If we do see a breakout, bulls may look to target previous resistance at 10.95 next. Meanwhile, if the recent rally turns out to be yet another false dawn for USD/ZAR bulls, a reversal back to key support at the 61.8% Fibonacci retracement and 200-day MA near 10.35 could come into play.
This research is for informational purposes and should not be construed as personal advice. Trading any financial market involves risk. Trading on leverage involves risk of losses greater than deposits.
Recommended Content
Editors’ Picks
AUD/USD: Extra gains in the pipeline above 0.6520

AUD/USD partially reversed Tuesday’s strong pullback and regained the 0.6500 barrier and beyond in response to the sharp post-FOMC pullback in the Greenback on Wednesday.
EUR/USD meets support around 1.0650

EUR/USD managed to surpass the key 1.0700 barrier in response to the intense retracement in the US Dollar in the wake of the Fed’s interest rate decision and Chair Powell’s press conference.
Gold surpasses $2,300 as Dollar tumbles

The precious metal maintains its constructive stance and trespasses the $2,300 region on Wednesday after the Federal Reserve left its FFTR intact, matching market expectations.
Bitcoin price reclaims $59K as Fed leaves rates unchanged

The market was at the edge of its seat on Wednesday to see whether the US Federal Reserve (Fed) would cut interest rates during the Federal Open Market Committee (FOMC) meeting.
The market welcomes the Fed's statement

The market has welcomed the Fed statement, and the S&P 500 is higher in its aftermath, the dollar is lower and Treasury yields are falling. There is still only one cut priced in by the Fed.
