Still on the road that the moment and rather than comment on the ridiculous machinations of what the Greek Prime Minister said last night – that even if Greece votes no they can stay in the Euro – or even talk about the 3.6% falls in the DAX (nice charts lately hey) and the CAC, or the massive reversal in the Euro – setting up more gains possibly. I want to focus on the outlook for the S&P 500 today.
That’s because the S&P is the global stock market bellwether, the one all other markets look to for guidance.
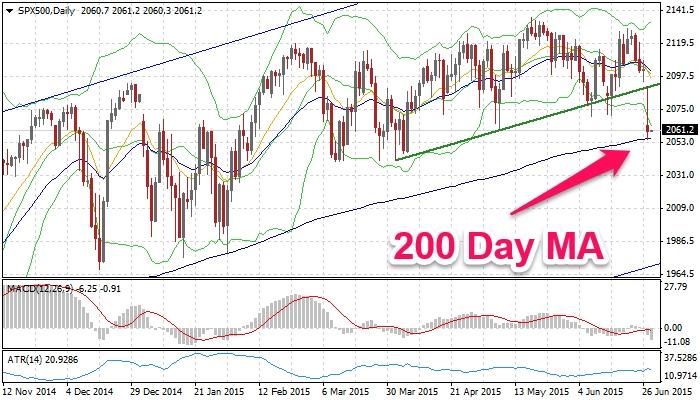
Last night the S&P dropped 2.07% to close around 2058. That’s just above the 2053/55 region where, depending on who you ask, the 200 day moving average is sitting.
As you know the 200 day moving average is the simplest, and often the first, way many traders use to judge whether a market is in a bull or bear phase. Above it, buy the dip, below it sell rallies is what is often said.
You can see in the chart above the break of recent trendline and then the support the 200 day moving average gave the market overnight.
As I wrote at Business Insider this morning:
The big question for fund and portfolio managers – and for traders and investors – is whether or not they try to get out of dodge early to avoid further losses or they hang on in the hope that like every other hiccup in the last 3 or 4 years, weakness gives way to a bounce.
The 200 day moving average is an important part of those deliberations. SO to is the 4 year uptrend on a weekly basis.
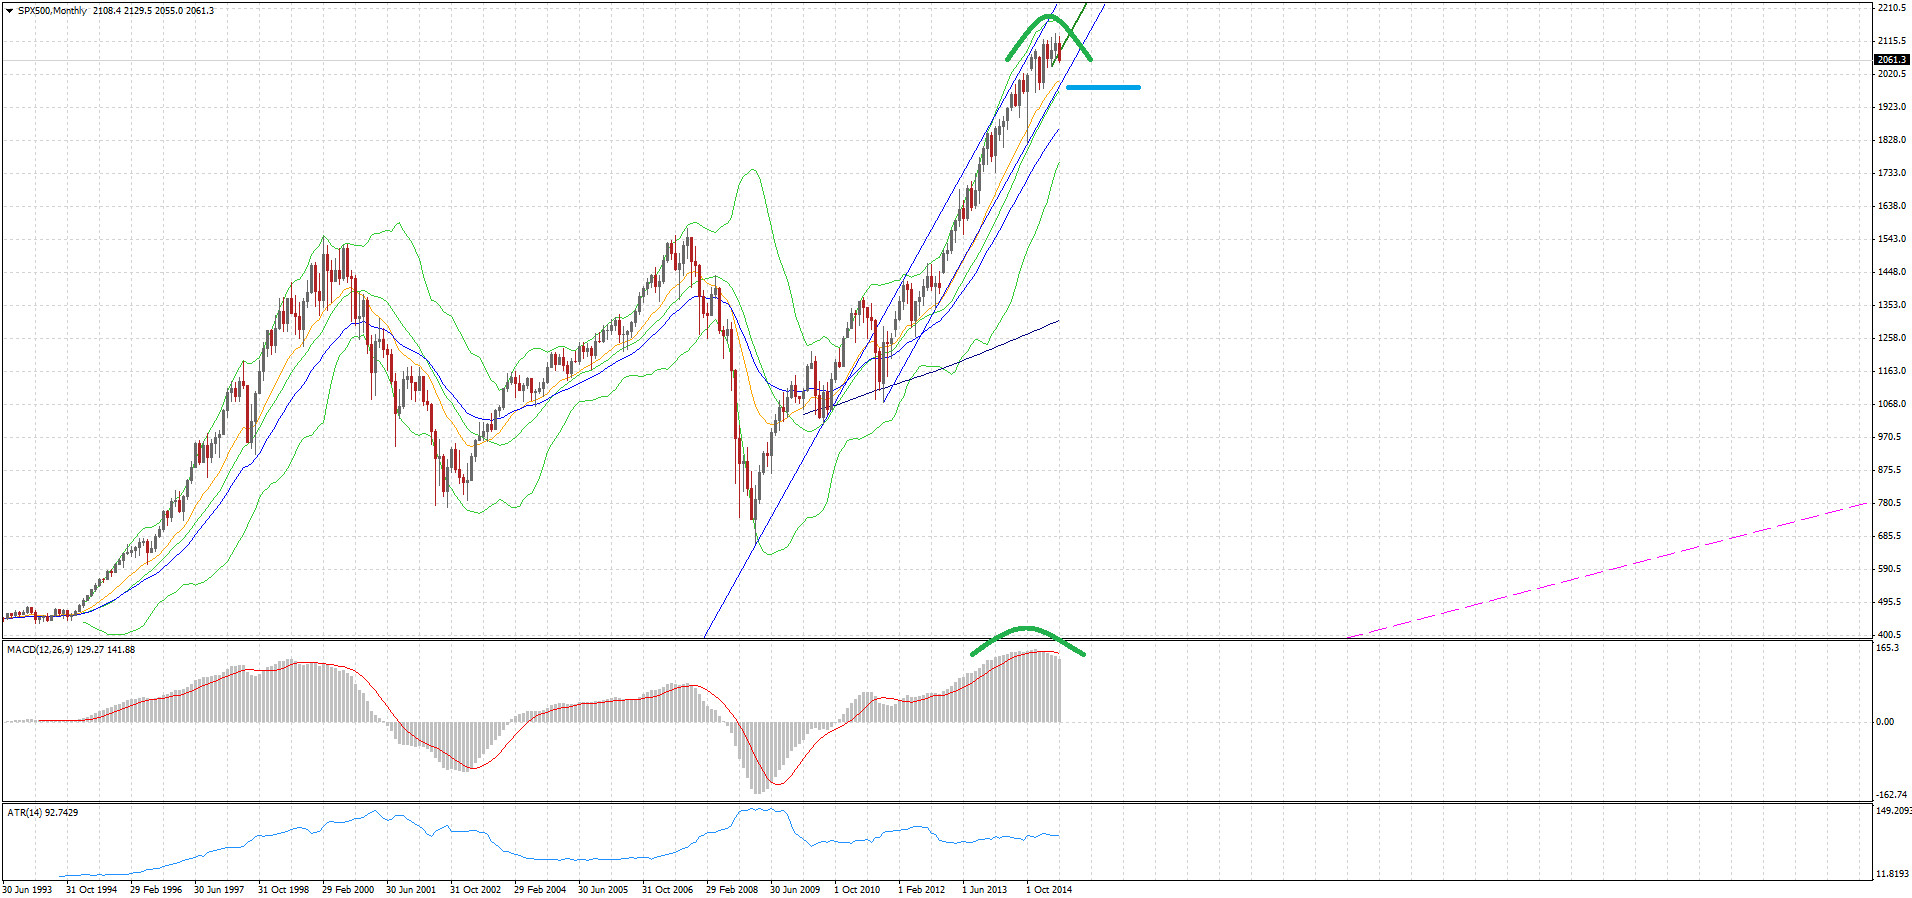
But I want you to also think about the overall market structure.
Have a look at the monthly S&P chart. Remind you of anything? Shanghai recently? Gold half a decade ago?.
This is a monthly chart so it will take a while to play out. But history and my system suggest winter is coming.
Recommended Content
Editors’ Picks
EUR/USD edges lower toward 1.0700 post-US PCE

EUR/USD stays under modest bearish pressure but manages to hold above 1.0700 in the American session on Friday. The US Dollar (USD) gathers strength against its rivals after the stronger-than-forecast PCE inflation data, not allowing the pair to gain traction.
GBP/USD retreats to 1.2500 on renewed USD strength

GBP/USD lost its traction and turned negative on the day near 1.2500. Following the stronger-than-expected PCE inflation readings from the US, the USD stays resilient and makes it difficult for the pair to gather recovery momentum.
Gold struggles to hold above $2,350 following US inflation

Gold turned south and declined toward $2,340, erasing a large portion of its daily gains, as the USD benefited from PCE inflation data. The benchmark 10-year US yield, however, stays in negative territory and helps XAU/USD limit its losses.
Bitcoin Weekly Forecast: BTC’s next breakout could propel it to $80,000 Premium

Bitcoin’s recent price consolidation could be nearing its end as technical indicators and on-chain metrics suggest a potential upward breakout. However, this move would not be straightforward and could punish impatient investors.
Week ahead – Hawkish risk as Fed and NFP on tap, Eurozone data eyed too

Fed meets on Wednesday as US inflation stays elevated. Will Friday’s jobs report bring relief or more angst for the markets? Eurozone flash GDP and CPI numbers in focus for the Euro.

