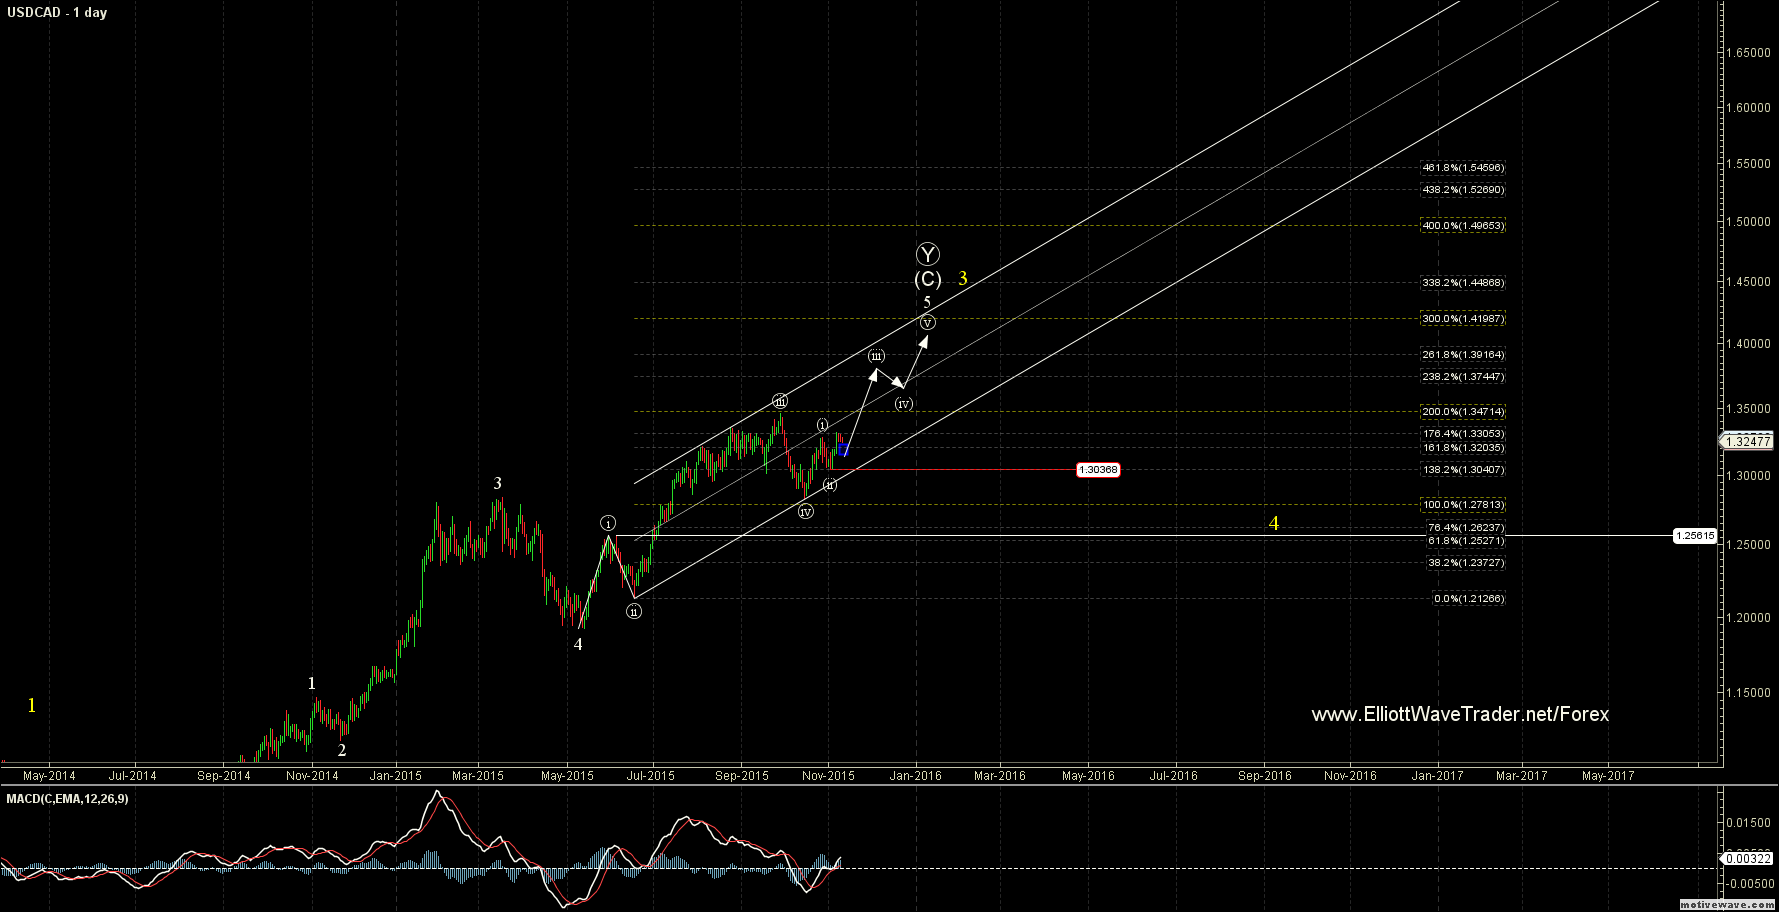
If we start by looking at the daily chart on the USD/CAD we can see that so far we have a fairly clean 3 wave move up off of the May 13th low into the September 28th high. Notice that the September 28th high came just shy of the 200 Fibonacci extension from the initial wave up off of the May 13th low. The September 28th high was then followed by deep retrace that bottomed just above the 100 extension of our initial move of off the May 13th low. Both of these Fibonacci levels are standard targets that we expect to see hit under the Fibonacci Pinball guidelines.
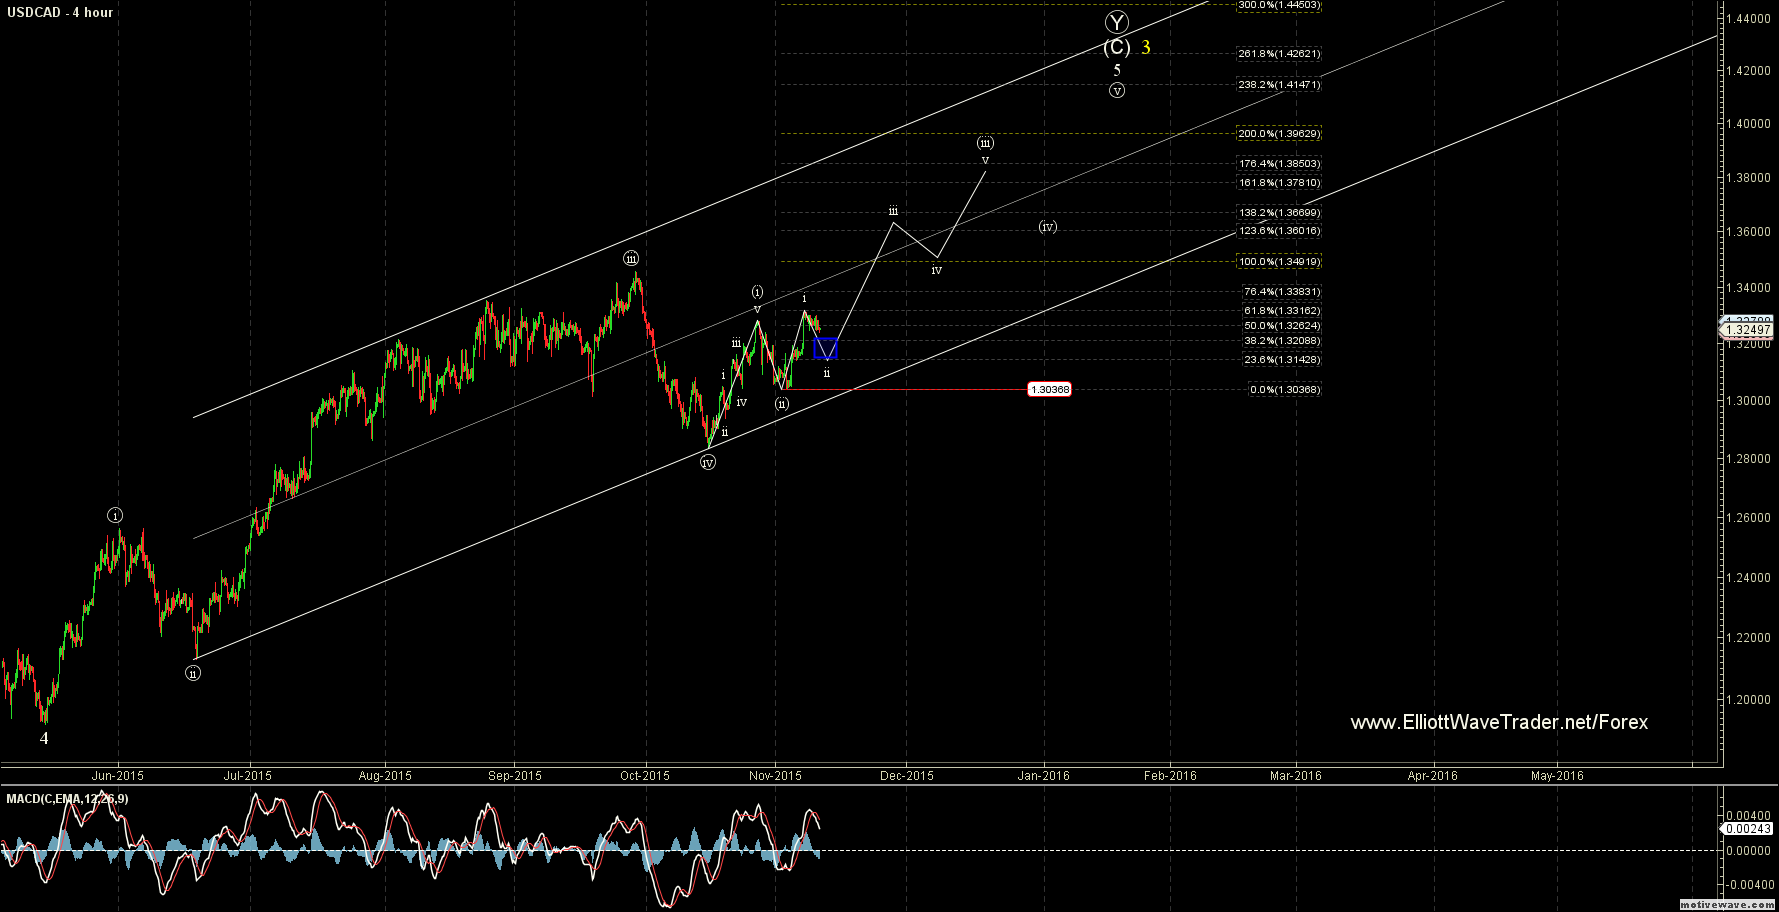
If we drill down to the four hour chart we will notice that the initial move up off of the 10/15 low was indeed a five wave move. Now with that being said this five wave move did not come in form of a standard non-overlapping impulse but rather in the form of an overlapping leading diagonal. This wave structure in and of itself is not a highly reliable pattern in which we would want to trade against. The more conservative approach is to wait for further confirmation of a trend before entering a trade when we are faced with a potential leading diagonal.
Making the assumption for our charting purposes that we did in fact have a leading diagonal for this initial move up off of the October 15th low we would then label move as wave (i) of ((v)). We would next be looking fora corrective retrace for wave (ii) into the 38.2 – 61.8 retracement level. In this case we saw a retrace that bottomed on November 2nd that endedjust over the 50% retracement level of the initial move up off of the October 15th low. This is well within the expected range for a second wave within Elliott Wave.
Next we are looking for is a strong impulsive move off of this low to give us further confirmation that we have indeed begun our third wave up. Once again in this case this is exactly what we saw with a very strong rally into the most recent high that topped on November 6th at the 1.3316 level. This 1.3316 level just so happens to have been almost exactly 61.8% as long as the first move up off of the October 15th low which is providing us with further validation that we are seeing follow-through on our impulsive path that should ultimately take us higher.
So from here what the ideal scenario takes us into the 1.3215 – 1.3143 level as a retrace for wave ii of (iii) which we would then expect to be followed by a very strong move higher for wave iii of (iii). Again using our Fibonacci Pinball guidelines we can set some initial targets for the projected path of this move. Our first initial target for wave iii of (iii)comes in at the 1.3601 – 1.3666 range with target for wave v of (iii) coming inat the 1.3781 – 1.3850 range. After these levels are hit we would then expect to see a deeper retrace before finally completing our last push higher into the 1.391 – 1.4198 level for wave (v) of ((v)).
Now because this is following our Fibonacci Pinball guidelines very well thus far we have a fairly high confidence level in this particular trade setup with a very good risk to reward ratio. Of course even the very best setups are not infallible and thus we need to know at which level this particular setup breaks down and invalidates. In this case the invalidation level occurs with a break of the 1.3036 level as it is against the rules of Elliott Wave for a second wave to terminate beyond the originating point of wave one.


Again I encourage you to also read Avi Gilburt’s Basics of Fibonacci Pinball here after you read this real world and real time example of trading the USD/CAD using Fibonacci Pinball.
The commentaries and analysis represent the opinions of the analyst nd should not be relied upon for purposes of effecting securities transactions or other investing strategies, nor should they be construed as an offer or solicitation of an offer to sell or buy any security. You should not interpret these opinions as constituting investment advice. Our analysts may have personal positions in the instruments mentioned.
Recommended Content
Editors’ Picks
EUR/USD edges lower toward 1.0700 post-US PCE

EUR/USD stays under modest bearish pressure but manages to hold above 1.0700 in the American session on Friday. The US Dollar (USD) gathers strength against its rivals after the stronger-than-forecast PCE inflation data, not allowing the pair to gain traction.
GBP/USD retreats to 1.2500 on renewed USD strength

GBP/USD lost its traction and turned negative on the day near 1.2500. Following the stronger-than-expected PCE inflation readings from the US, the USD stays resilient and makes it difficult for the pair to gather recovery momentum.
Gold struggles to hold above $2,350 following US inflation

Gold turned south and declined toward $2,340, erasing a large portion of its daily gains, as the USD benefited from PCE inflation data. The benchmark 10-year US yield, however, stays in negative territory and helps XAU/USD limit its losses.
Bitcoin Weekly Forecast: BTC’s next breakout could propel it to $80,000 Premium

Bitcoin’s recent price consolidation could be nearing its end as technical indicators and on-chain metrics suggest a potential upward breakout. However, this move would not be straightforward and could punish impatient investors.
Week ahead – Hawkish risk as Fed and NFP on tap, Eurozone data eyed too

Fed meets on Wednesday as US inflation stays elevated. Will Friday’s jobs report bring relief or more angst for the markets? Eurozone flash GDP and CPI numbers in focus for the Euro.