EUR/USD
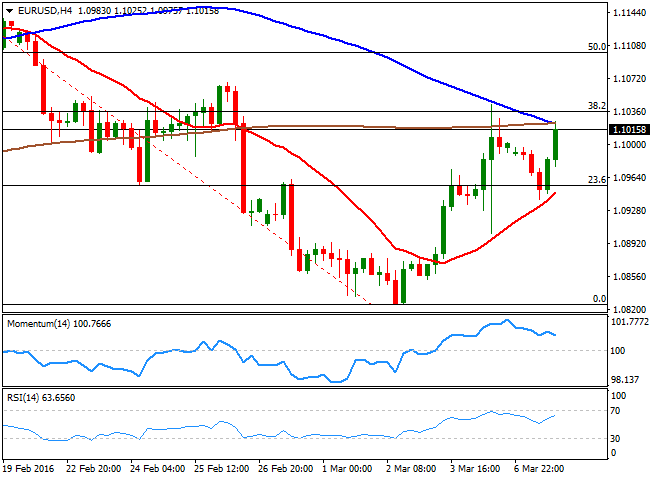
An early rally of the greenback was quickly reverted by speculative interest, with the market favoring selling the American currency at higher levels. The USD entered negative territory mid American afternoon, falling beyond Friday's lows against most of its major rivals but the EUR, still subdued ahead of the upcoming ECB economic policy decision later this week. A sharp recovery in oil prices was behind dollar's selloff, as the commodity reached fresh year highs on hopes a bottom has been reached. The common currency found little support in local data, as the EU Sentix confidence index fell to 5.5 against previous 8.0 for March, while German Factory Orders edged 0.1% lower, above the 0.5% expected, but the second monthly decline inarow, indicating the economic slowdown is reaching the European largest economy. The EUR/USD pair fell down to 1.0939 before trimming losses, and the 4 hours chart shows that a bullish 20 SMA provided a strong intraday dynamic support. Nevertheless, the pair remains below it’s the 38.2% retracement of its latest daily slump in the 1.1040 region, also Friday's high and the level to break to confirm further gains. The technical indicators in the mentioned time frame hold in positive territory, but lack clear directional strength, suggesting the pair may continue trading within its recent range during the upcoming sessions.
Support levels: 1.0980 1.0950 1.0920
Resistance levels: 1.1045 1.1080 1.1120
GBP/USD
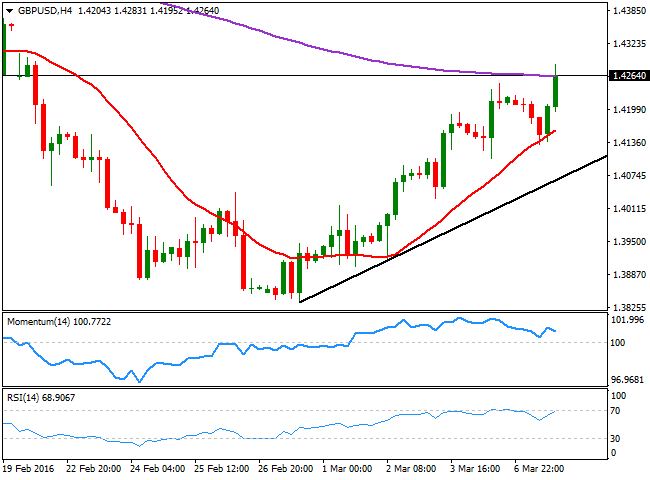
The British Pound surged to a fresh 2week high of 1.4283 against the greenback, helped by news that the Bank of England is ready to offer extra liquidity around the time of the Brexit referendum. The Central Bank said it will closely monitor market conditions, and that it will add three extra indexes LTRO's by the ends of June. Adding to dollar's broad weakness, the news brought some relief to those expecting a plummeting Pound, should the kingdom leave the EU. Anyway, and from a technical point of view, the pair advanced for sixth day inarow, with a daily close above 1.4250 suggesting an interim bottom has taken place. The price is now aiming to fill the weekly opening gap left last February 21st, at 1.4356, the next probable bullish target on a break above 1.4300. The 4 hours chart, shows that the rally stalled around its 200 EMA, but an early slide met buying interest around a bullish 20 SMA, currently around 1.4160. In the same chart, the RSI indicator heads north around 69, also supporting the ongoing bullish bias, although the Momentum indicator has lack its previous bullish slope, and turned slightly lower within bullish territory, suggesting some consolidation before next leg north.
Support levels: 1.4260 1.4215 1.4160
Resistance levels: 1.4290 1.4330 1.4360
USD/JPY
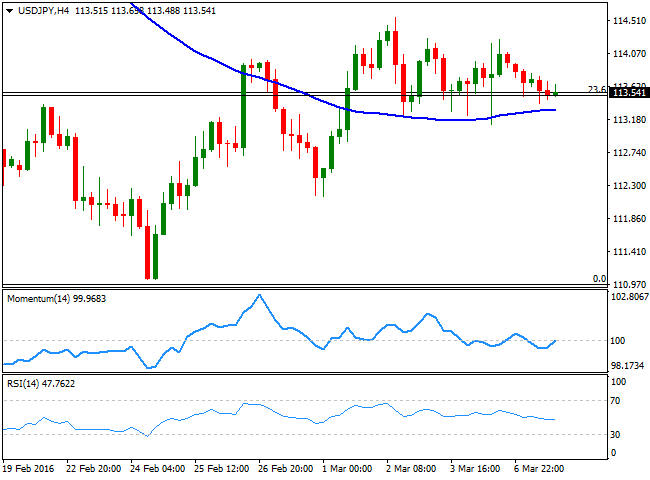
The USD/JPY pair trades lifeless around the 113.50 region, the 23.6% retracement of the latest daily slump between 121.68 and 110.97, but with the bears still on the drivers' seat. Early Monday, BOJ's Governor Kuroda said that the Central Bank will asset the effects of negative interest rates, suggesting no additional measures are currently planned, whilst maintaining his optimistic outlook for the country's economic outlook. The news helped the Yen rallying during Asian trading hours, but there was no follow through after Wall Street's opening, amid surging stocks and commodity. The short term outlook keeps favoring the downside, as the price in the 1 hour chart is currently developing below its 100 SMA, whilst the technical indicators in the same time frame have been unable to advance beyond their midlines, and are currently resuming their declines. In the 4 hours chart, the pair presents a neutral stance, with the price a handful of pips above a horizontal 100 SMA, and the Momentum indicator hovering around its 100 level. The RSI indicator however, keeps heading south around 46, supporting additional declines on a slide below the 113.10 level, the immediate support.
Support levels: 113.10 112.70 112.35
Resistance levels: 113.80 114.25 114.60
GOLD
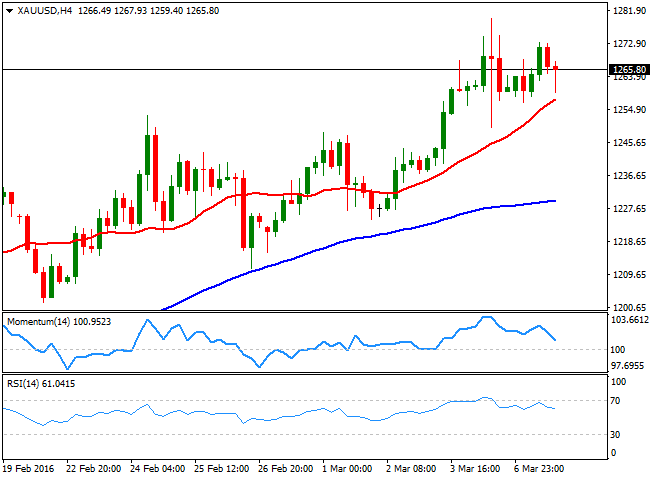
Gold continued to be on demand, with spot edging modestly higher on Monday, as stocks advanced. Nevertheless, it held within Friday's range and trades below $1,270.00 a troy ounce by the end of the US session, amid increasing uncertainty over whether the Federal Reserve will raise interest rates next week. US policymakers have been giving mixed signals lately, in one hand, saying that economic conditions have changed since December decision, but on the other reiterating that the Central Bank is still willing to offer 34 rate hikes this year. Spot's daily chart shows that the price is well above a still bullish 20 SMA, while the Momentum indicator aims higher after a limited downward move within bullish territory, still lacking enough strength to confirm additional advances. In the same chart, the RSI indicator stands flat around 70. Shorter term, the 4 hours chart shows that the 20 SMA has advanced further below the current level, providing a strong dynamic support around 1,256.20, although the technical indicators retreated from their highs, also lacking enough strength to support an upcoming rally.
Support levels: 1,256.20 1,242.50 1,234.90
Resistance levels: 1,271.80 1,279.75 1,286.90
WTI CRUDE
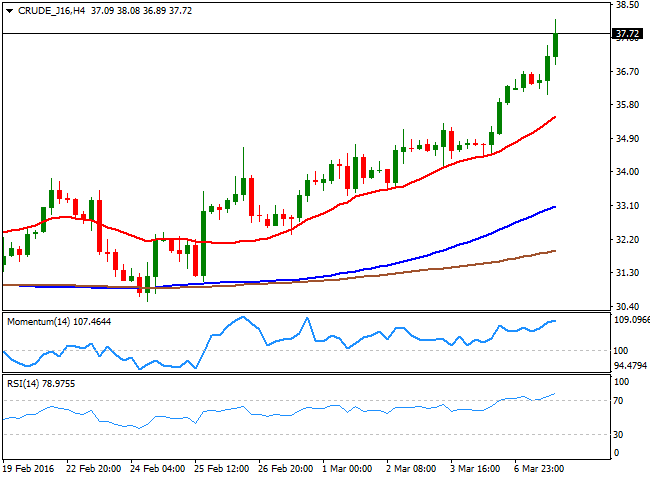
Crude oil is the star of the day, outperforming on hopes worldwide producers will reach a deal to freeze production during their upcoming meeting this March, whilst OPEC members are working to boost prices to $50.00 a barrel, a new anchor for global prices. During London trading hours, Brent crude surged to its highest for the year beyond $40.00, whilst US sweet, light crude followed through. WTI futures traded as high as $ 38.08 a barrel before easing some, but maintaining the upward tone into the close. Technically, the daily chart shows that the price extended further above its 100 DMA, while the technical indicators maintain their upward momentum near overbought territory. In the 4 hours chart, the 20 SMA accelerated its advance below the current level, while the RSI indicator heads north around 78, and the Momentum indicator consolidates above 100, showing no directional strength, all of which suggests that the commodity may correct lower during the upcoming session. Nevertheless, dips down to $35.00 will likely be seen now by speculative interests as buying opportunities.
Support levels: 37.10 36.35 35.50
Resistance levels: 38.10 39.00 39.80
DAX
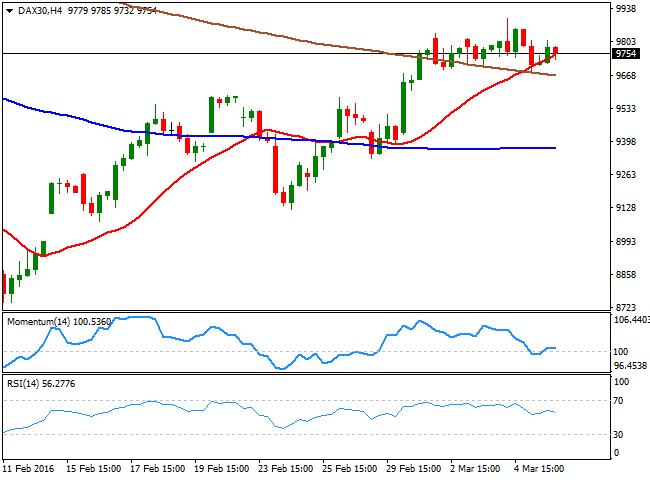
The German DAX fell 0.46% to end the day at 9,778.93, weighed by poor local manufacturing data, and uncertainty on what Mario Draghi may have up his sleeve. Factory Orders in Germany during January decreased by seasonally adjusted 0.1% compared to December, according to provisional data published by the Federal Statistical Office Destatis, down by second month inarow. Deutsche Bank gave back 1.5%, while automakers led the way south, as Volkswagen fell by 3.2% and BMW closed down by 0.9%. The index holds around the daily close ahead of the Asian opening, having trimmed early losses and with the daily chart showing another daily doji, in line with the mentioned uncertainty among investors. The technical indicators have retreated partially within positive territory, but stand flat well above their midlines, as the 20 SMA maintains a clear bullish below the current level. In the 4 hours chart, a mild positive tone prevails, as the index holds a few points above a bullish 20 SMA, whilst the technical indicators have retreated from overbought territory, but stalled their declines above their midlines, showing no directional strength at the time being.
Support levels: 9,732 9,690 9,648
Resistance levels: 9,837 9,924 10,000
DOW JONES
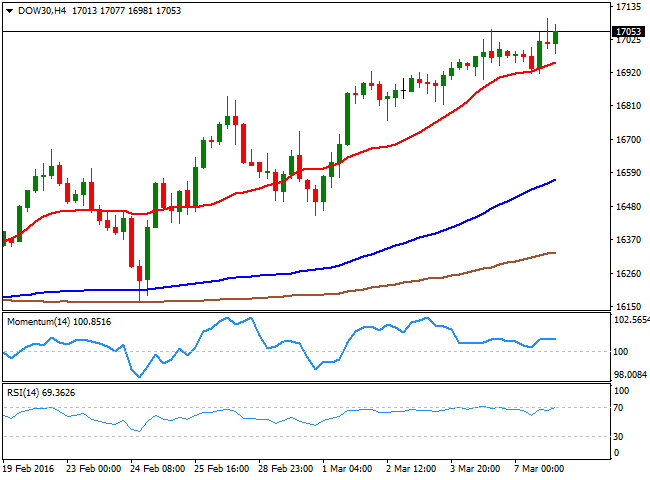
US indexes closed the day mixed around their opening levels, with investors unmotivated ahead of upcoming Central Banks' decisions. The ECB will have its economic meeting this week, while the FED will meet the next one, and as the date looms, investors turn cautious on speculation the FOMC may not be as dovish as lately suspected. The Dow advanced 67 points to end at 17,073.95, the Nasdaq shed 0.19% to close at 4,708.25, while the SandP closed at 2,001.76, up by 0.09%. The technical picture for the DJIA keeps favoring the upside, as daily basis, the index closed above its 200 DMA for the first time since early January, the Momentum indicator resumed its advance after a modest decline within bullish territory, whilst the RSI indicator extended further towards overbought readings, and stands now at 67, its highest for the year, supportive of a continued advance. Shorter term, the 4 hours chart shows that the 20 SMA keeps leading the way higher, offering a strong dynamic support, now around 16,951, while the RSI indicator also heads north near overbought levels, although the Momentum indicator holds flat above its 100 level, showing no certain directional strength.
Support levels: 17,002 16,951 16,909
Resistance levels: 17,105 17,174 17,243
FTSE 100
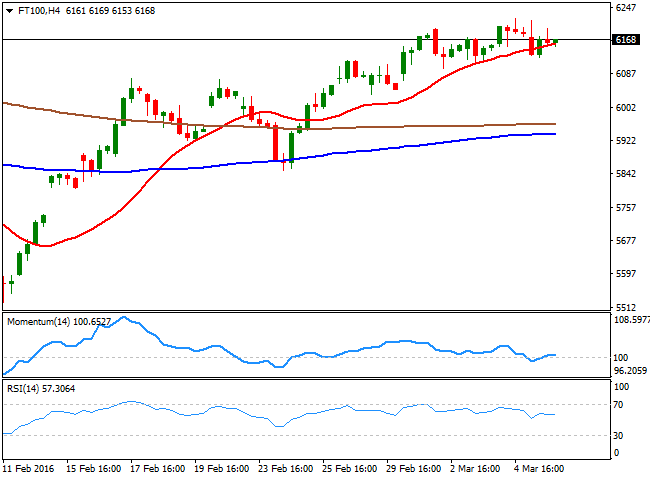
The FTSE 100 edged 45 points lower on Monday, closing at 9,778.93. UK stocks failed to advance, despite the strong recovery in commodities, with oil giants BP closing down 0.6% and Royal Dutch Shell 0.5% lower. Metal related shares were also lower, with Randgold Resources down by 3.0% after Morgan Stanley cut its rating to equal weight from overweight. Glencore, however, closed up 6.7%, extending its latest outstanding recovery. Overall, the negative tone of the Footsie was based on fears over an economic slowdown, after China downgraded its growth forecast. From a technical point of view, the daily chart shows that an early slide towards the 100 DMA was quickly reversed, while the 20 SMA continues heading north well below the current level. The technical indicators in the mentioned time frame turned lower within positive territory, not enough to confirm further slides for this Tuesday. Shorter term, the 4 hours chart shows that a slightly positive tone prevails, given that the index is holding above a bullish 20 SMA, whilst the technical indicators are currently posting tepid advances above their midlines.
Support levels: 6,142 6,094 6,027
Resistance levels: 6,221 6,286 6,350
The information set forth herein was obtained from sources which we believe to be reliable, but its accuracy cannot be guaranteed. It is not intended to be an offer, or the solicitation of any offer, to buy or sell the products or instruments referred herein. Any person placing reliance on this commentary to undertake trading does so entirely at their own risk.
Recommended Content
Editors’ Picks
EUR/USD edges lower toward 1.0700 post-US PCE

EUR/USD stays under modest bearish pressure but manages to hold above 1.0700 in the American session on Friday. The US Dollar (USD) gathers strength against its rivals after the stronger-than-forecast PCE inflation data, not allowing the pair to gain traction.
GBP/USD retreats to 1.2500 on renewed USD strength

GBP/USD lost its traction and turned negative on the day near 1.2500. Following the stronger-than-expected PCE inflation readings from the US, the USD stays resilient and makes it difficult for the pair to gather recovery momentum.
Gold struggles to hold above $2,350 following US inflation

Gold turned south and declined toward $2,340, erasing a large portion of its daily gains, as the USD benefited from PCE inflation data. The benchmark 10-year US yield, however, stays in negative territory and helps XAU/USD limit its losses.
Bitcoin Weekly Forecast: BTC’s next breakout could propel it to $80,000 Premium

Bitcoin’s recent price consolidation could be nearing its end as technical indicators and on-chain metrics suggest a potential upward breakout. However, this move would not be straightforward and could punish impatient investors.
Week ahead – Hawkish risk as Fed and NFP on tap, Eurozone data eyed too

Fed meets on Wednesday as US inflation stays elevated. Will Friday’s jobs report bring relief or more angst for the markets? Eurozone flash GDP and CPI numbers in focus for the Euro.
