EUR/USD
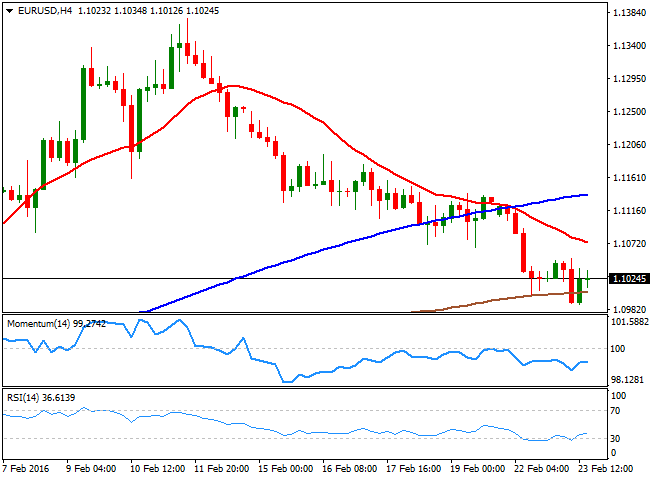
The euro managed to steady on Tuesday while the pound extended losses to fresh cycle lows against the US dollar as appetite for risk lost momentum and concerns over a possible ‘Brexit’ continued to weigh. EUR/USD came under pressure during the European session on the back of disappointing German IFO report which showed business climate index fell to 105.7 in February, below the 106.8 reading expected, while the expectations index hit 98.8, its lowest level since November 2014. During the American afternoon US data came in mixed, but the dollar barely reacted.EUR/USD briefly fell below the 1.10 mark and posted its lowest level in three weeks at 1.0989 but managed to recover slightly and it has spent the last hours in a range just above 1.1000. Technically, the 1 hour chart shows indicators flat below their midlines while spot trades just below a flat 20SMA, maintaining a slight negative tone. In the 4 hours chart, RSI has already corrected oversold conditions and indicators remain in negative territory, favouring a downward continuation, with the 1.0900 area as next bearish target.
Support levels: 1.0990 1.0962 1.0900
Resistance levels: 1.1050 1.1090 1.1140
GBP/USD
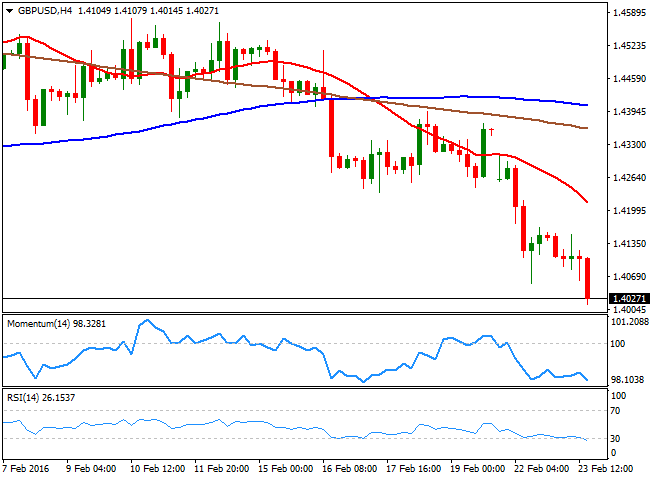
Fears of a Brexit continued to weigh on the pound on Tuesday, with GBP/USD falling to fresh 7year lows during the American afternoon. UK Prime Minister Cameron scheduled an EU membership referendum for June 23rd and growing uncertainty ahead of the vote might keep the Sterling vulnerable in the shortterm. GBP/USD bottomed out at 1.4012, finding support a few pips ahead of major support at 1.4000. Shortterm technical picture remains clearly bearish as per indicators heading south below their midlines, but both 1 hour and 4 hours charts exhibit oversold conditions, suggesting the pound might take a breather before resuming the slide. GBP/USD needs at least to regain the 1.4200 level to ease immediate bearish pressure and increase chances of a stronger recovery. On the downside, a break below 1.4000 will fuel the fall, with 1.3850 standing as next major support area.
Support levels: 1.4000 1.3900 1.3850
Resistance levels: 1.4200 1.4260 1.4305
USD/JPY
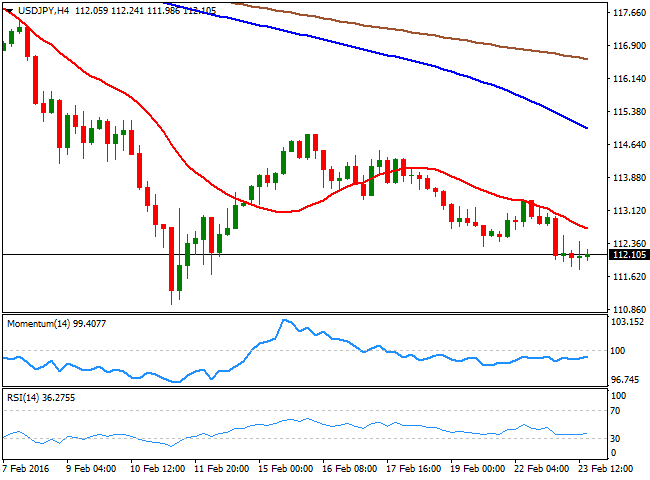
USD/JPY fell sharply during the Asian session as the yen advanced after BoJ Governor Kuroda expressed further doubts about their QQE program's ability to raise prices. The negative tone in stock markets fueled JPY strength and sent USD/JPY below the 112.00 level to an 11day low of 111.77 before finding support. USD/JPY has steadied near daily lows over the last hours and even though indicators have lost bearish potential, the downside remains favoured. In 1 hour charts, indicators remain below their midlines, while the pair trades under a bearish 20SMA. In 4 hours charts, RSI and Momentum hover in negative territory although with flat slopes suggesting some consolidation ahead. A break below 111.65 however, could increase the bearish pressure exposing the 2016 low at 110.97.
Support levels: 111.65 110.97 110.10
Resistance levels: 113.05 113.50 114.00
GOLD
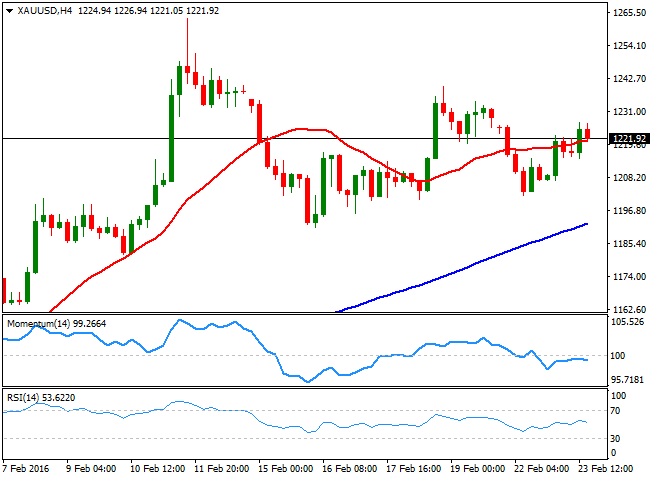
Gold prices advanced more than 1% to $1,227 a troy ounce as the decline in oil prices and the resulting risk aversion in the equities triggered a flight to safety. The weakness in the treasury yields also added to the bullish tone around gold prices. The metal finished the day around $1,222/oz which is above 20SMA in the 4 hour chart. In the daily chart, the RSI continues heading lower from overbought territory, indicating shortterm bearish potential. However, the rising 20SMA in the daily along with the bullish RSI in the 4 hour chart and the closing above 20SMA indicates the commodity is likely to be bought on dips. Overall, the upside is favoured unless a break below $1,218 leads the RSI moving below 50.00 levels.
Support levels: 1,190 1,182 1,175
Resistance levels: 1,226 1,235, 1251
WTI CRUDE
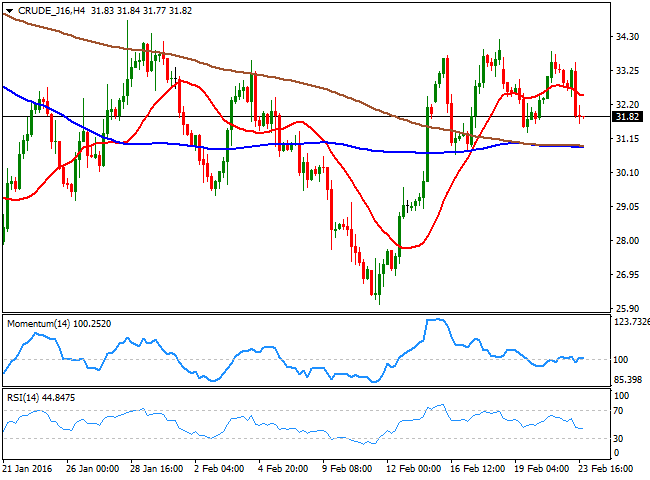
Oil prices in the US fell more than 4.5% on Tuesday to $31.80 a barrel after Iran said it is unrealistic to expect the country would join the SaudiRussia production freeze strategy and called the plan ‘ridiculous’. Furthermore, Saudi oil minister AlNaimi said a production cut will not happen and the market will rebalance and demand will pick up. Consequently, both oil benchmarks took a beating and pushed risk assets lower in the US. From technical viewpoint, the bearish pressure could remain intact as prices closed below a falling 20SMA in the 4 hours chart and the RSI dipped further into the bearish territory. Meanwhile, downside stands exposed, more so if the commodity drops below 20SMA support seen in the daily chart at $30.86.
Support levels: 30.86 29.24 27.53
Resistance levels: 32.52 34.19 34.80
DAX
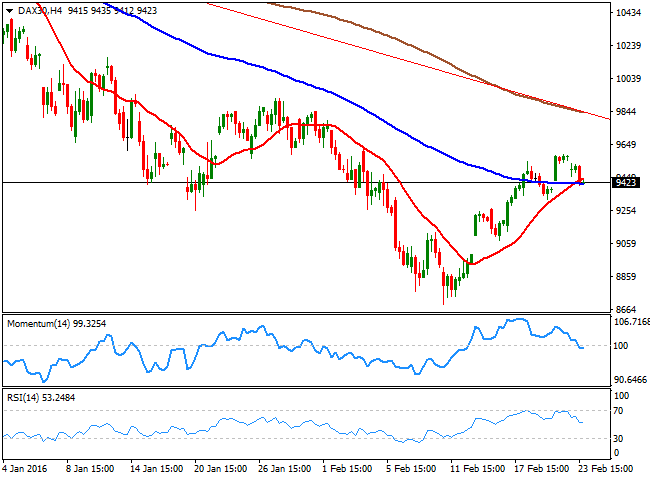
The German DAX index closed 156.82 points or 1.64% lower on Tuesday at 9,416.77. Oil prices once again torpedoed the equity market sentiment. The bears also found additional support from the German IFO survey release, which showed the business climate fell to 14month low in February. Energy firm RWE AG shares tumbled 5.24% while banking shares also took a hit, with Deutsche Bank shares falling 3.67% and Commerzbank shares losing 1.95%. On the other hand, airliner Lufthansa managed to tick higher by 0.22%. On the daily chart, the index looks strong but with 20SMA still falling, the immediate upside appears limited. Nevertheless, the bullish crossover between 20SMA and 100SMA is likely to see the index being bought on dips. The daily RSI now stands at 48.43, but the Momentum indicator stays well above its midline. Overall, a minor dip could be quickly undone, while the immediate upside potential looks restricted around the falling trend line resistance.
Support levels: 9,347 9,256 9,200
Resistance levels: 9,500 9,629 9,660
DOW JONES
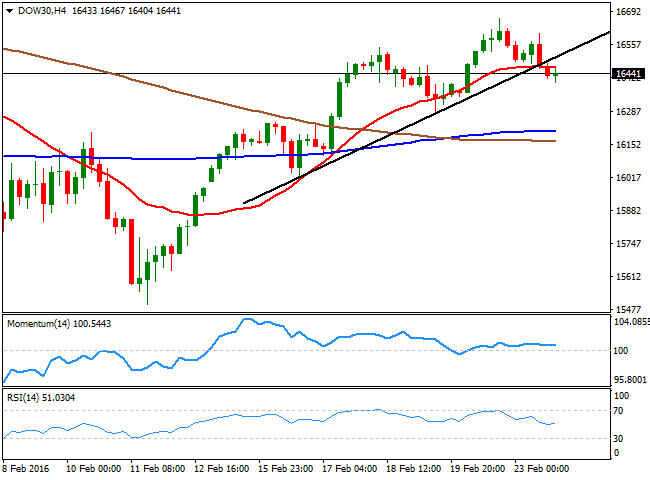
The DJIA index closed 189.08 points or 1.14% lower on Tuesday at 16,431.58. The SandP 500 index closed 1.23% lower at 1,921.60 and the tech heavy Nasdaq declined 1.6%. Investors got a reminder about the vulnerability of the stock market rally to gyrations in oil prices. Drop in Chinese yuan and the slide in oil was enough to trigger a flight to safety. Energy shares and materials producers led declines. Shares in FreeportMcMoRan Inc. declined 6.5% and shares in Chevron Corp fell 4.2%. Banking stocks also took a hit, with JP Morgan sliding more than 3%. From technical perspective, the DJIA index appears weak after breaching the rising trend line in the 4 hours chart while the RSI is pointing to a dip below the 50.00 level as well. Furthermore, the daily close below 16,510 adds credence to the bearish view. Overall, shortterm bearishness is likely and the upticks could be sold into unless the index rises above Monday’s high of 16,665.
Support levels: 16,348 16,204 16,164
Resistance levels: 16,510 16,665 17,019
FTSE 100
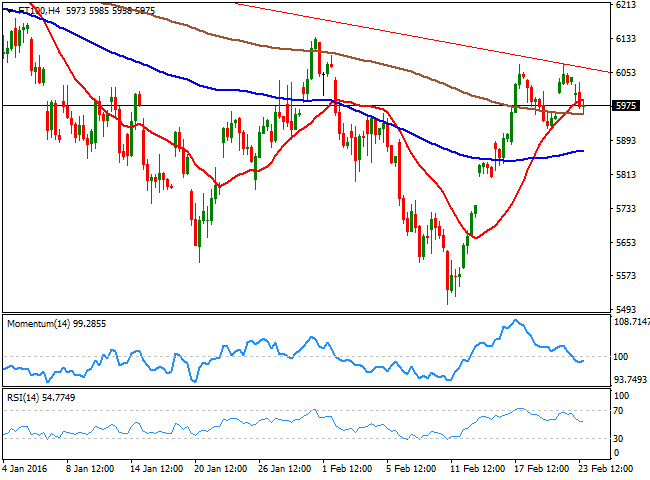
The UK’s FTSE index ended 75 points or 1.25% lower on Tuesday at 5,962.31. The bullish tone seen on Monday ran out of steam as oil prices headed southwards in early Europe and then in the US session. Oil prices had briefly turned positive, despite which the index remained in the negative territory on Brexit fears. Miners and Energy shares took a hit, with shares in Antofagasta and Anglo American dropping 6% each. Randgold Resources gained 2%, tracking the rise in gold prices. From the technical perspective, the weak closing marked a third failure near the falling trend line resistance. The daily Momentum indicator and the daily RSI indicator remain in favour of a bullish move. Furthermore, the bullish crossover between 20SMA and 200SMA in 4 hours chart adds credence to the bullish daily indicators. The index could be bought on dips towards the 20SMA on the daily chart, with upside looking capped around the falling trend line resistance.
Support levels: 5,863 5,768 5,700
Resistance levels: 6,000 6,072 6,141
The information set forth herein was obtained from sources which we believe to be reliable, but its accuracy cannot be guaranteed. It is not intended to be an offer, or the solicitation of any offer, to buy or sell the products or instruments referred herein. Any person placing reliance on this commentary to undertake trading does so entirely at their own risk.
Recommended Content
Editors’ Picks
EUR/USD edges lower toward 1.0700 post-US PCE

EUR/USD stays under modest bearish pressure but manages to hold above 1.0700 in the American session on Friday. The US Dollar (USD) gathers strength against its rivals after the stronger-than-forecast PCE inflation data, not allowing the pair to gain traction.
GBP/USD retreats to 1.2500 on renewed USD strength

GBP/USD lost its traction and turned negative on the day near 1.2500. Following the stronger-than-expected PCE inflation readings from the US, the USD stays resilient and makes it difficult for the pair to gather recovery momentum.
Gold struggles to hold above $2,350 following US inflation

Gold turned south and declined toward $2,340, erasing a large portion of its daily gains, as the USD benefited from PCE inflation data. The benchmark 10-year US yield, however, stays in negative territory and helps XAU/USD limit its losses.
Bitcoin Weekly Forecast: BTC’s next breakout could propel it to $80,000 Premium

Bitcoin’s recent price consolidation could be nearing its end as technical indicators and on-chain metrics suggest a potential upward breakout. However, this move would not be straightforward and could punish impatient investors.
Week ahead – Hawkish risk as Fed and NFP on tap, Eurozone data eyed too

Fed meets on Wednesday as US inflation stays elevated. Will Friday’s jobs report bring relief or more angst for the markets? Eurozone flash GDP and CPI numbers in focus for the Euro.
