EUR/USD
The dollar faded its early strength on Friday, to end generally lower across the board. Some profit taking alongside with continued market turmoil has favored a recovery of safehaven assets, in spite US inflation data for January came in stronger than expected, with the headline rate unchanged on the month, and the core rate rising by 0.3%mom. Headline inflation in January is now double that in December at 1.4%YoY, with the core rate is now at 2.2%, above the previous 2.1%. European data was for the most soft, with German´s index of producer prices for industrial products fell by 2.4% compared with the corresponding month of the preceding year, and by 0.7% compared to December 2015, while later in the day, data showed that consumer confidence in the Eurozone has plummeted to 8.8 in February from a reading of 6.3 the month before. Right after the closing bell, the EU reached a settlement deal with the UK, which diminishes dramatically chances of a Brexit, and therefore have strong bullish implications for the Pound. The EUR/USD pair closed the day with gains at 1.1129, after a fiveday losing streak. Technically the daily chart shows that the price has managed to hold above a still bullish 20 SMA, yet at the same time, the lower highs daily basis and the fact that the Momentum indicator turned south and nears its 100 level, suggests the risk remains towards the downside for the upcoming week. In the 4 hours chart, the technical picture is quite flat, with the technical indicators heading nowhere around their midlines, and the price stuck around a bearish 100 SMA.
Support levels: 1.1080 1.1045 1.1000
Resistance levels: 1.1160 1.1200 1.1245
GBP/USD
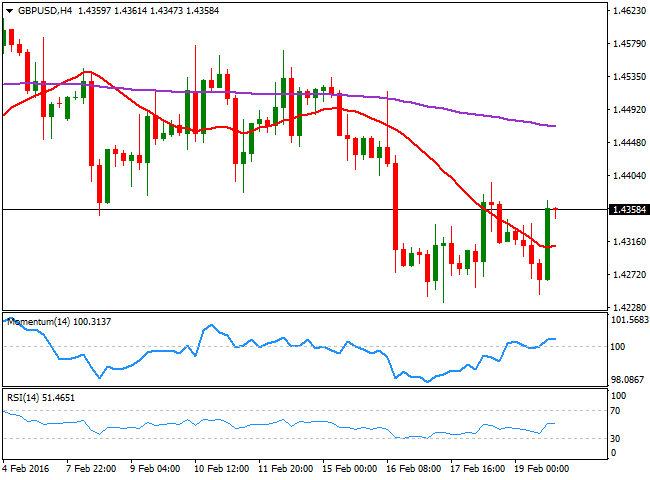
The GBP/USD pair managed to close Friday with gains above the 1.4300 level, but down on the week, weighed by fears over a Brexit. The 28 members of the EU met last Thursday and Friday, to discuss British conditions to remain within the region. Right after the closing bell, European Union leaders reached a deal aimed at keeping the UK in the bloc, Lithuanian President Dalia Grybauskaite said, which may result in the Pound gapping higher at the beginning of the next week. The daily chart shows that Friday's recovery helped the RSI indicator to turn higher, although the indicator remains well below its midline, while the Momentum indicator heads lower below its 100 level. In the same chart, the 20 SMA has lost its upward strength around 1.4460, providing a strong resistance in the case of some gains this Monday. In the shorter term, the 4 hours chart shows that the price managed to accelerate beyond a horizontal 20 SMA before beginning to consolidate, leaving the technical indicators with no certain direction, but above their midlines, which limits chances of a decline, at least in the short term.
Support levels: 1.4340 1.4290 1.4240
Resistance levels: 1.4370 1.4410 1.4460
USD/JPY
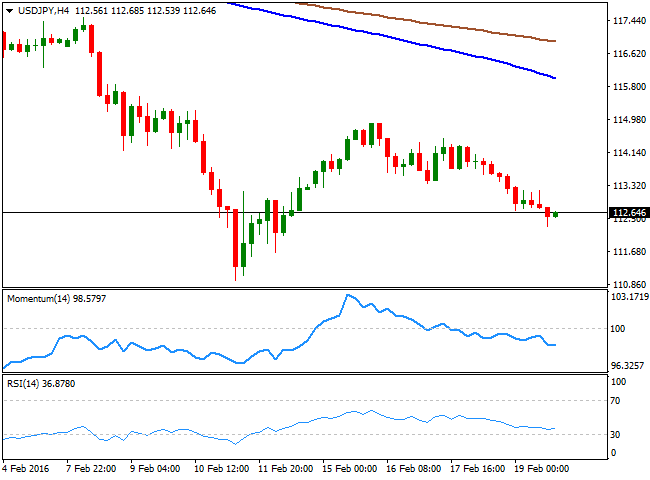
The USD/JPY pair closed a third straight week to the downside, edging lower on Friday on safehaven demand, and as US crude oil ended the week below $30.00 a barrel. The Japanese currency has appreciated sharply after a short lived decline following BOJ's decision to cut rates into negative territory, and speculation grows that the Central Bank will take action to lower the value of the yen. Nevertheless, the pair keeps falling and the daily chart shows that the latest advance has been just enough for the technical indicators to correct extreme oversold readings. Ahead of a new weekly opening, the RSI indicator has turned back south near 30, while the Momentum aims slightly higher, still far from showing upward strength. In the same chart, the 100 and 200 SMAs are turning south far above the current level, being irrelevant at the time being. In the 4 hours chart, the technical indicators head lower within bearish territory, whilst the moving averages have accelerated their declines, but also remain well above the current level. Should the decline extend beyond 112.10, the pair will likely retest the 111.00 region next week, and even extend its decline towards 110.00.
Support levels: 112.90 112.50 112.10
Resistance levels: 112.85 113.35 113.70
GOLD
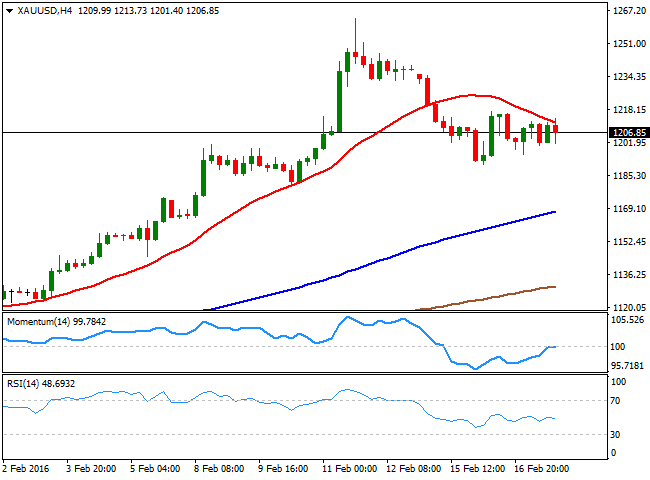
Gold closed the week slightly lower, after being buoyant for the previous four, with spot ending last Friday slightly down at $1,229.05, as positive US inflation figures lifted prospects of further tightening by the Federal Reserve. The bright metal has been largely favored by economic turmoil across the word, and fears that more Central Banks may join the latest easing path by adopting negative rates. Friday's price action was quite choppy, although the daily decline was not enough to affect the ongoing bullish trend, at least from a technical point of view, given that in the daily chart, the 20 SMA has accelerated its advance and maintains a strong bullish slope below the current level, whilst the technical indicators have barely turned south within overbought territory, but are far from suggesting a deeper decline. In the 4 hours chart, the price holds above a mild bullish 20 SMA, while the technical indicators have lost upward steam and turned slightly lower, but remain within bullish territory.
Support levels: 1,222.50 1,214.50 1,202.05
Resistance levels: 1,242.30 1,251.90 1,263.40
WTI CRUDE
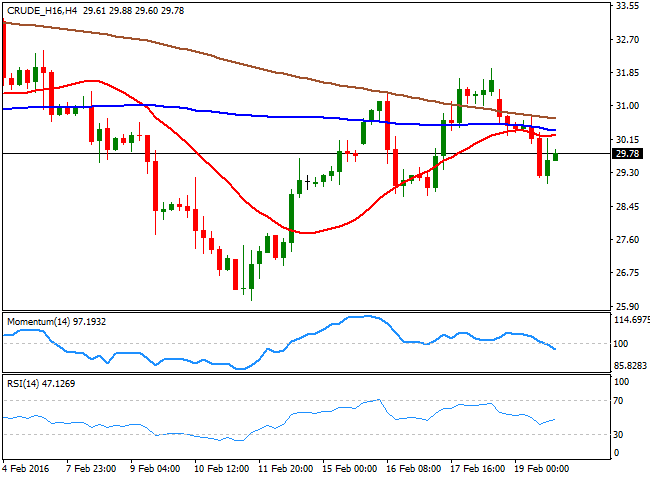
Crude oil prices settled lower on Friday, with WTI crude oil futures down by 3.7% to end at $29.70 a barrel. Weekly basis however, the black gold posted a tepid 0.7% advance. The Baker Hughes report showed that US drilling rigs have fallen for a ninth straight week, down by 26 to total 413. The commodity advanced up to $31.95 midweek, as several of the largest world oil producers agreed to freeze output at January levels. But after digesting the news, speculators resumed selling, as the measure is far from enough against the ongoing glut. Technically, the daily chart shows that on Friday, the price remained capped by a mild bearish 20 SMA, while the technical indicators have turned south within bearish territory, maintaining the risk towards the downside. In the shorter term, the 4 hours chart shows that the price is currently below its moving averages, while the Momentum indicator heads lower below its 100 level, and the RSI indicator hovers around 46, supporting the longer term perspective.
Support levels: 29.40 28.65 27.80
Resistance levels: 30.10 30.80 31.50
DAX
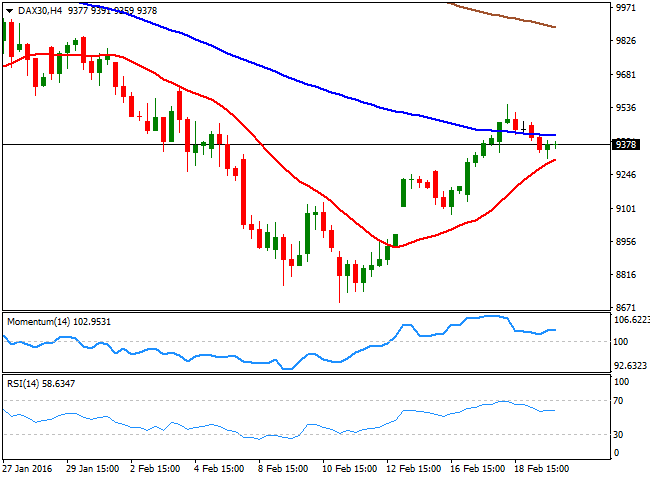
The German DAX closed 0.80% lower at 9,388.05, weighed by poor local Producer Price Index data in January, and the decline in crude oil's prices. Also, European stocks were mostly lower on Friday as sentiment turned negative on speculation that the European Central Bank will announce additional easing measures in their next meeting early March. The daily chart for the DAX shows that the index is hovering around a bearish 20 SMA, while the technical indicators have turned slightly lower after an approach to their midlines, maintaining the risk towards the downside, despite the ongoing lack of momentum. In the shorter term, the 4 hours chart shows that the index has managed to hold above a still bullish 20 SMA, while the technical indicators have recovered their bullish slopes above their midlines, in line with the longer term outlook.
Support levels: 9,320 9,281 9,206
Resistance levels: 9,426 9,516 9,608
DOW JONES
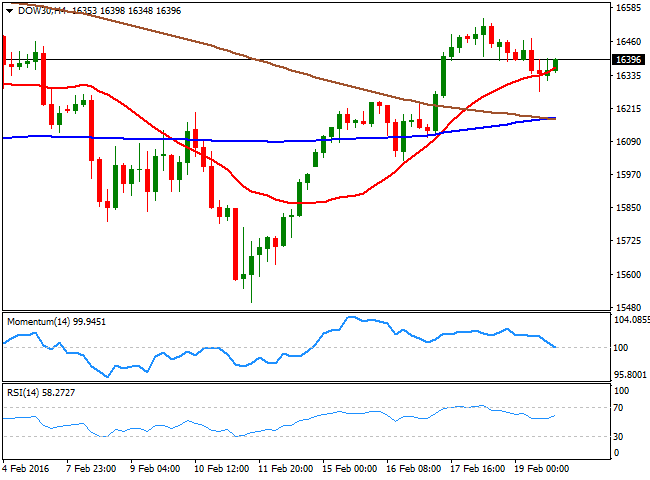
Worldwide stocks ended Friday sharply lower, although Wall Street closed mixed and pretty much unchanged with the Dow Jones 21 points lower at 16,391.99, the Nasdaq was up by 0.38% at 4,504.43, and the SandP ended flat at 1,917.78. Anyway, the Dow managed to add 2.6% last week, posting its best weekly gain of the year. Local shares traded slightly lower as oil resumed its slide, but the modest decline suggests that bulls are still in control. Technically, the daily chart shows that the index has trimmed most of its intraday losses, remaining well above a mild bullish 20 SMA, while the technical indicators have turned lower after advancing above their midlines, suggesting some gains beyond the weekly high at 16,546 are required to confirm a new leg higher. Shorter term, the 4 hours chart shows that the index met some buying interest around a still bullish 20 SMA, while the technical indicators diverge from each other, with the Momentum heading lower around its midline, and the RSI indicator heading north around 58, in line with the daily outlook.
Support levels: 16,386 16,277 16,202
Resistance levels: 16,470 16,546 16,630
FTSE 100
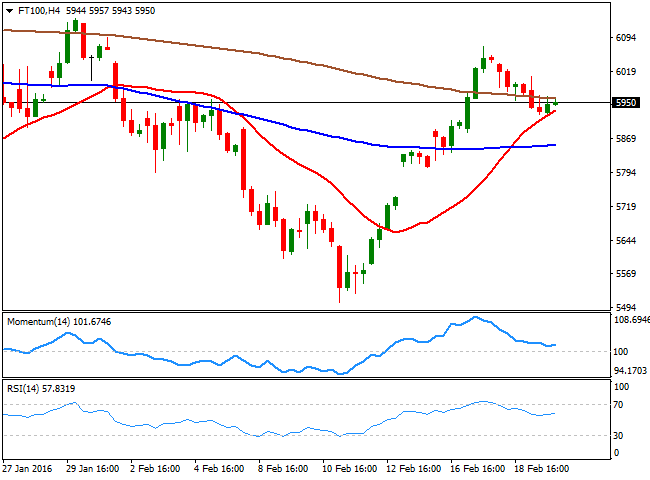
The FTSE 100 shed 21 points on Friday to close at 5,950.23, driven by a return of risk aversion, although it also ended up the week by 4.3%, its best week since last October. Commodity related stocks were mixed, with energy related ones down, led by Royal Dutch Shell, which shed 1.67%. The mining sector, however, outperformed, with Randgold up 2.50% and Fresnillo advancing by 3.59%. The agreement to prevent a Brexit will probably send the index higher at the beginning of this week, with steady gains beyond the 6,000 level eyed. Technically however, the daily chart is far from supporting additional gains, given that the index retreated towards a horizontal 20 SMA, while the Momentum indicator holds within bearish territory, with no directional strength, and the RSI indicator turned lower, now around 52. In the 4 hours chart, the index has held above a bullish 20 SMA, while the technical indicators have lost their downward strength within bullish territory and after correcting overbought levels, aiming now higher, supporting the bullish case for the benchmark.
Support levels: 5,922 5,945 5,909
Resistance levels: 6,027 6,093 6,140
The information set forth herein was obtained from sources which we believe to be reliable, but its accuracy cannot be guaranteed. It is not intended to be an offer, or the solicitation of any offer, to buy or sell the products or instruments referred herein. Any person placing reliance on this commentary to undertake trading does so entirely at their own risk.
Recommended Content
Editors’ Picks
EUR/USD edges lower toward 1.0700 post-US PCE

EUR/USD stays under modest bearish pressure but manages to hold above 1.0700 in the American session on Friday. The US Dollar (USD) gathers strength against its rivals after the stronger-than-forecast PCE inflation data, not allowing the pair to gain traction.
GBP/USD retreats to 1.2500 on renewed USD strength

GBP/USD lost its traction and turned negative on the day near 1.2500. Following the stronger-than-expected PCE inflation readings from the US, the USD stays resilient and makes it difficult for the pair to gather recovery momentum.
Gold struggles to hold above $2,350 following US inflation

Gold turned south and declined toward $2,340, erasing a large portion of its daily gains, as the USD benefited from PCE inflation data. The benchmark 10-year US yield, however, stays in negative territory and helps XAU/USD limit its losses.
Bitcoin Weekly Forecast: BTC’s next breakout could propel it to $80,000 Premium

Bitcoin’s recent price consolidation could be nearing its end as technical indicators and on-chain metrics suggest a potential upward breakout. However, this move would not be straightforward and could punish impatient investors.
Week ahead – Hawkish risk as Fed and NFP on tap, Eurozone data eyed too

Fed meets on Wednesday as US inflation stays elevated. Will Friday’s jobs report bring relief or more angst for the markets? Eurozone flash GDP and CPI numbers in focus for the Euro.

