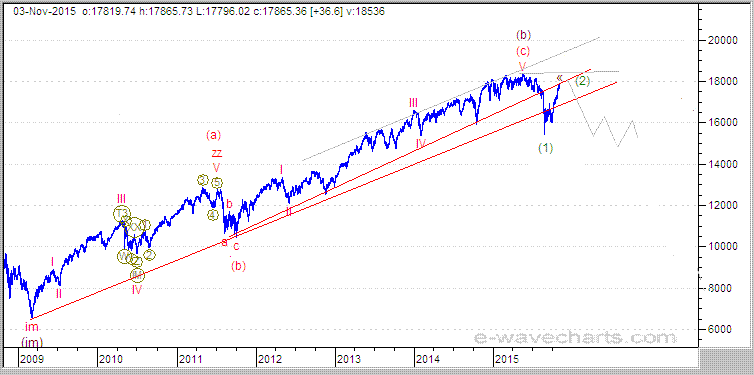
Our DOW Forecast from Nov 3rd 2015

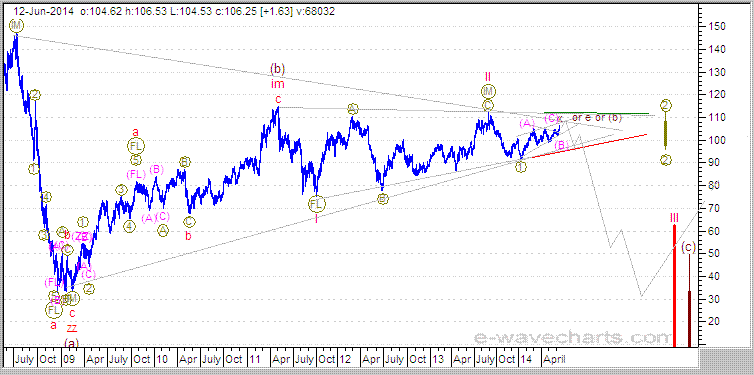
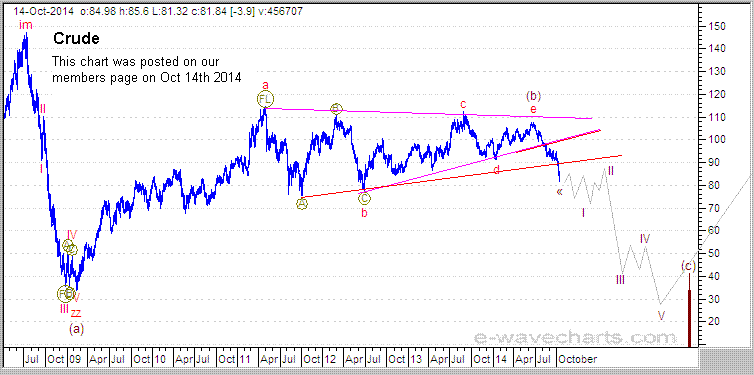
We called the top in Crude in July of 2014 and confirmed the wave (c) decline after it broke the first lower trendline. We had another confirmation on Oct 9th 2014 when it broke the second lower trendline. The charts below were posted on our site on Jun 12 2014 and on Oct 14th 2014. The first Crude chart was posted when the price was still over $100. We had a minimum target of $30-$32 which has now been broken and we should see further downside to complete this wave down. Keep in mind that Crude was trading at $11 a barrel in 1998, although we don't expect to see it move this low at this juncture. Many of the oil stocks still have considerable downside ahead which have extremely lagged the decline in Crude. The continued downside in Crude could align with the expected lows for the XOI index, but if not, it could suggest that we will see a long sideways pattern after Crude bottoms in a Leading Diagonal pattern. We will determine this possibility of a Leading Diagonal pattern when Crude bottoms and compare it with the oil stocks and XOI index. We will want to determine if the XOI has bottomed with Crude, or if the XOI has further bottoming action ahead. We are already looking ahead to determine how Crude will bounce off the bottom, since a Leading Diagonal pattern will be difficult to trade. Crude may not bounce as it did at the 2009 lows.
Our Crude Forecast on Jun 12 2014

Our Crude Forecast on Oct 14th 2014

Quick Notes on Gold, USD, Real Estate, TNX -10 Year US Treasury Yield (interest rates)
1: We are expecting a large rally in Gold, Silver and the HUI, but we should see further downside in wave V before this advance begins. The metals and associated stocks are extremely over sold and a substantial bounce is lining up this year.2: The USD has further upside ahead in wave V which aligns with the forecast for the metals and Crude. The upper trendline for the USD is near the 103 area.
3: Our Real Estate chart indicates that a high is in place for wave (b) up, similar to the DOW chart above.
4: Our TNX chart for yields indicates further downside in wave II down, before wave III up.
The lower trendline is near the 1.8 area.
I wanted to provide an update on the equity markets since they have been in a very long process of topping in the parabolic advance, but with wave (2) up complete, the downside should continue to accelerate in wave (3) down, although we are expecting a small bounce on Tuesday Jan 19th.
I also have the Oct 2014 Crude chart above posted on the main page of the site, so I am just advising that the $30 forecast level on this chart is not the bottom. We still have further downside in wave V ahead for Crude, but we should also see a small bounce for Crude on Tuesday Jan 19th. We changed the count for Crude from the Elliott Wave abcde triangle pattern on the second chart back to a number of 1's and two's in the triangle pattern illustrated on the first chart.
This will be an interesting year with many long term trends changing.
Safe investments that are guaranteed will be critical.
These charts are only a guide so that you can follow the action and monitor the expected outcome. The action could play out exactly as illustrated or it may need minor adjustments as we follow it through.
Legal Terms and Conditions The following are terms amd conditions you should know if you wish to access the Elliott Wave Chart Site. The Elliott Wave Chart Site is providing this web site, on an "as is, as available" basis to users. You use this web site at your own risk. The Elliott Wave Chart Site and its offerings are for informational and educational purposes only. It is not our intent to advise you on when to buy or sell. Our intent is to inform you of our personal view of the stock market,short term trading strategies and opportunities. None of the analysis mentioned on this site should indicate you to buy or sell without you first doing your own analysis. None of the techniques discussed here should be undertaken without extensive study, back testing and paper trading analysis. It is very important for you to understand that our approach to trading can be very risky and volatile, which means that your losses may be extensive. Specifically day trading and swing trading involve high risks and you can lose a lot of money. The Elliott Wave Chart Site assumes no liability nor responsibility for any decisions made by any reader or participant of this web site. No liability is assumed for publication of any third party opinions or analysis. Past performance is no guarantee of future results. We suggest you seek the advice of a financial professional before you make any changes to your current investment strategies. All data and information is correct to the best of our knowledge at the time of publication. Again, no guarantee or warranty is offered or implied.
Recommended Content
Editors’ Picks
EUR/USD edges lower toward 1.0700 post-US PCE

EUR/USD stays under modest bearish pressure but manages to hold above 1.0700 in the American session on Friday. The US Dollar (USD) gathers strength against its rivals after the stronger-than-forecast PCE inflation data, not allowing the pair to gain traction.
GBP/USD retreats to 1.2500 on renewed USD strength

GBP/USD lost its traction and turned negative on the day near 1.2500. Following the stronger-than-expected PCE inflation readings from the US, the USD stays resilient and makes it difficult for the pair to gather recovery momentum.
Gold struggles to hold above $2,350 following US inflation

Gold turned south and declined toward $2,340, erasing a large portion of its daily gains, as the USD benefited from PCE inflation data. The benchmark 10-year US yield, however, stays in negative territory and helps XAU/USD limit its losses.
Bitcoin Weekly Forecast: BTC’s next breakout could propel it to $80,000 Premium

Bitcoin’s recent price consolidation could be nearing its end as technical indicators and on-chain metrics suggest a potential upward breakout. However, this move would not be straightforward and could punish impatient investors.
Week ahead – Hawkish risk as Fed and NFP on tap, Eurozone data eyed too

Fed meets on Wednesday as US inflation stays elevated. Will Friday’s jobs report bring relief or more angst for the markets? Eurozone flash GDP and CPI numbers in focus for the Euro.