Market Overview
Volatility in Asian markets has been elevated by the significant fluctuations in the Chinese Shanghai stock market. However, the big impact is coming across the commodities complex which remains under significant pressure as questions over the sustainability of Chinese demand continue to drag prices lower. The prices of oil, copper and gold are all under pressure. This is weighing on any indices with exposure to these markets such as the FTSE 100, which fell yesterday towards it key July 6430 low. However, such is the volatility in these markets, the European indices have opened slightly higher in early trading. As is usually the case with China, traders will look towards the PBOC and the government to step in to prevent any significant contagion and this could be helping to stabilise the market today. In otehr news, Greece has begun talks over a third bailout today.
In forex trading there is a mixed outlook today. Although the dollar is stronger against the euro and yen; sterling is broadly flat in front of UK growth and the Aussie and Kiwi are slightly stronger. Traders will be watching for the first reading of UK Q2 GDP at 0930BST. The expectation is that there will be a strong reading of +0.7% quarter on quarter up from the +0.4% final reading of Q1. There is also the Case Shiller House Price at 1400BST which is expected to continue the positive housing data recently and show an improvement from 4.9% to 5.6%. The US Consumer Confidence will certainly be well watched at 1500BST but is expected to dip slightly to 100.0 from 101.4.
Chart of the Day – AUD/NZD
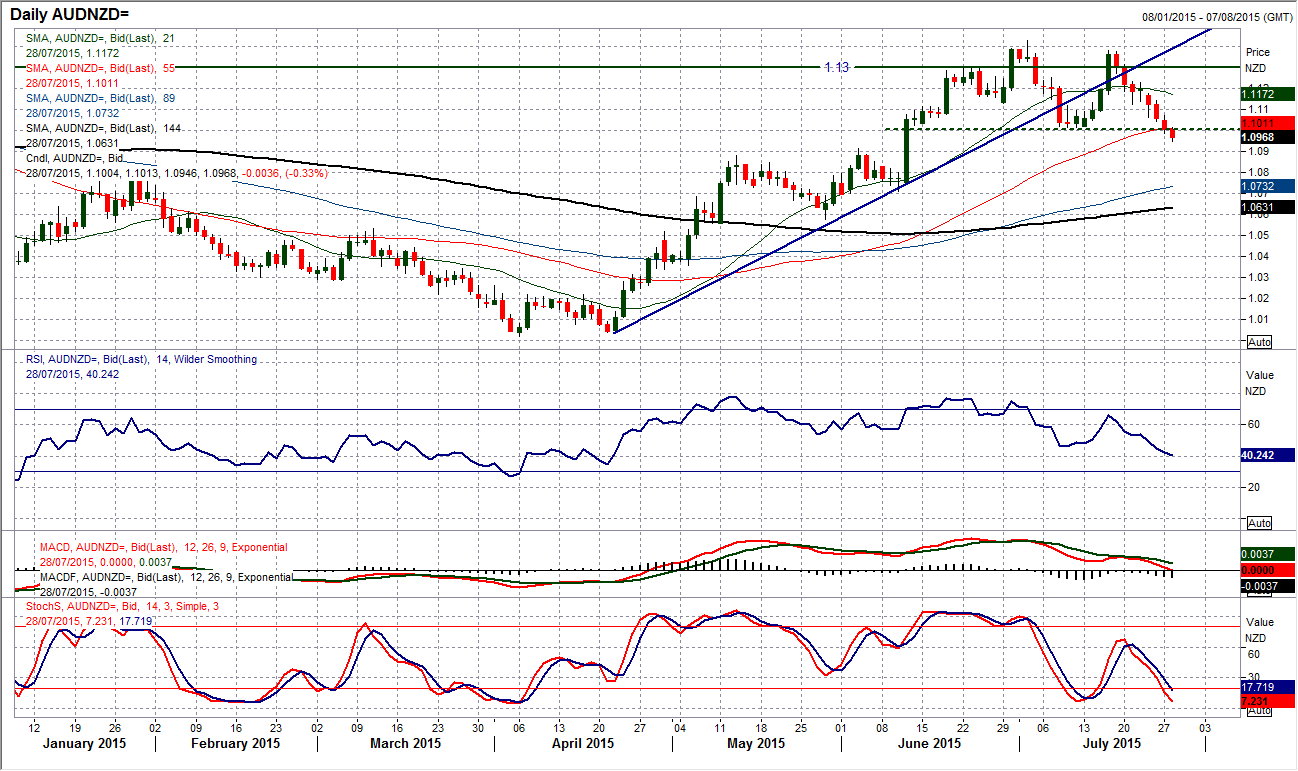
The Kiwi has certainly been one of the worst major currencies of the past few months, but the prospect of a near term recovery is growing. This is playing out through a correction on AUD/NZD . The uptrend in place since the April support at 1.0039 has now been broken by a closing yesterday at 1.0985, whilst the 21 day moving average (at 1.1173) which has been rising since late April and has been providing support, has now started to turn lower and suggests a near term correction. However, most interestingly, the top pattern has formed and the support at 1.1018 implying a downside corrective target of 360 pips back towards 1.0660. Support comes in initially at 1.0912 before the support at 1.0707. Daily momentum indicators confirm the deterioration with the RSI ad MACD lines at a 3 month low and Stochastics falling sharply. That would suggest that a significant top pattern is underway and the question is now whether the downside plays out immediately or following a bounce. However the intraday hourly chart shows the outlook remains extremely negative. The hourly momentum indicators are all in bearish sequence and the RSI continually fails around the 50 mark before the sellers resume control, whilst the hourly MACD and Stochastics are also showing continued downside. Look to use rallies as a chance to sell with resistance coming in around 1.1000/1.1050.
EUR/USD
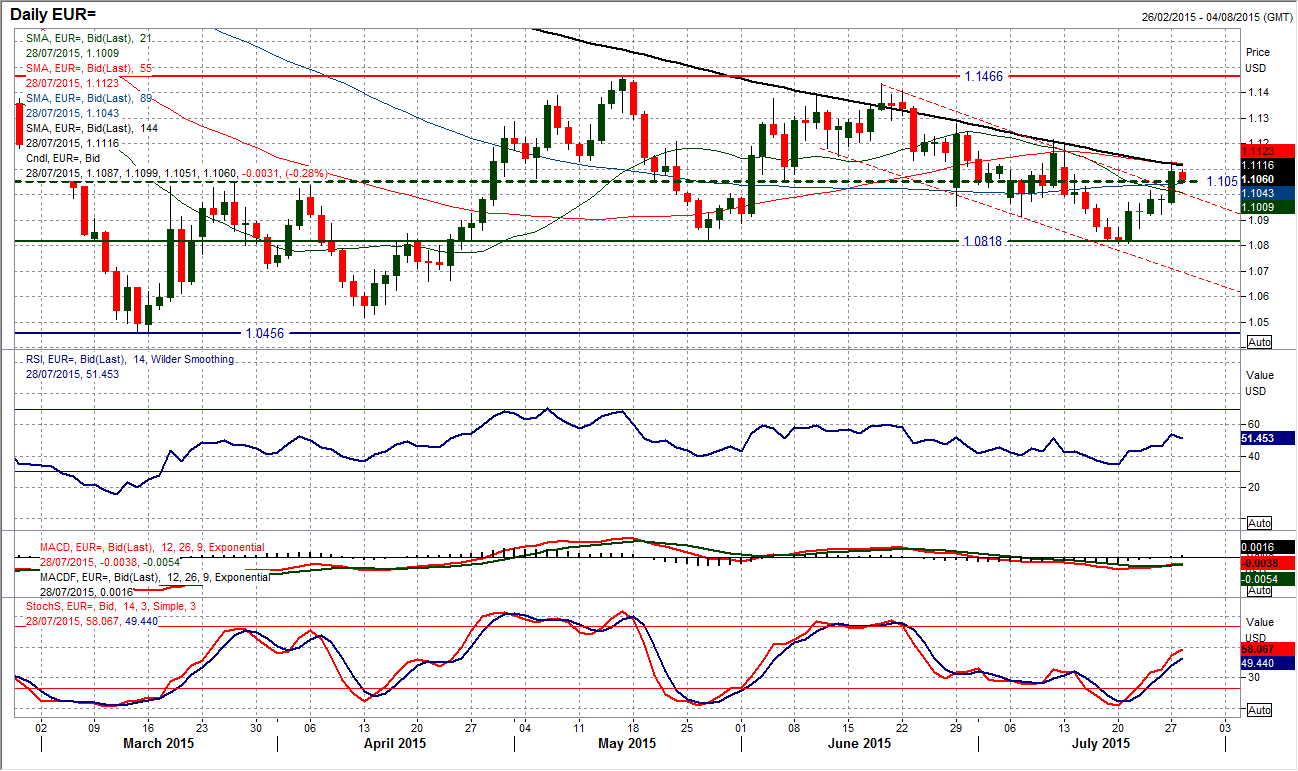
Since the euro hit the reaction high at $1.1436 in June, there has been a series of lower highs and lower lows on the daily chart. However, as with many selling phases, there may just be the odd near term counter trend move. For the past five sessions, the euro has been in recovery mode which has seen a move from a low at $1.0808 on 20th July to now stand over 250 pips higher. So, this now leads to the question of whether there is anything more in this move than a rally that will be sold into. I have for a while suggested that anytime the euro is below the medium term pivot at $1.1050 it is a bearish outlook and whilst above it, the outlook is more positive. This time though, I feel there needs to be more flexibility. The falling 144 day moving average has been an excellent basis of resistance in recent weeks (at $1.1115), whilst the previous reaction lower high at $1.1215 is also intact as resistance. The RSI is now up into the low 50s, whilst the MACD lines are also still negatively configures. The only factor that is positive now is the Stochastics which are rising. This suggests that a lot more needs to be done to suggest the bulls are controlling. I feel that another lower high is not far off now. Initial resistance is at $1.1128 with the intraday hourly chart showing support at $1.1056 and $1.1018.
GBP/USD
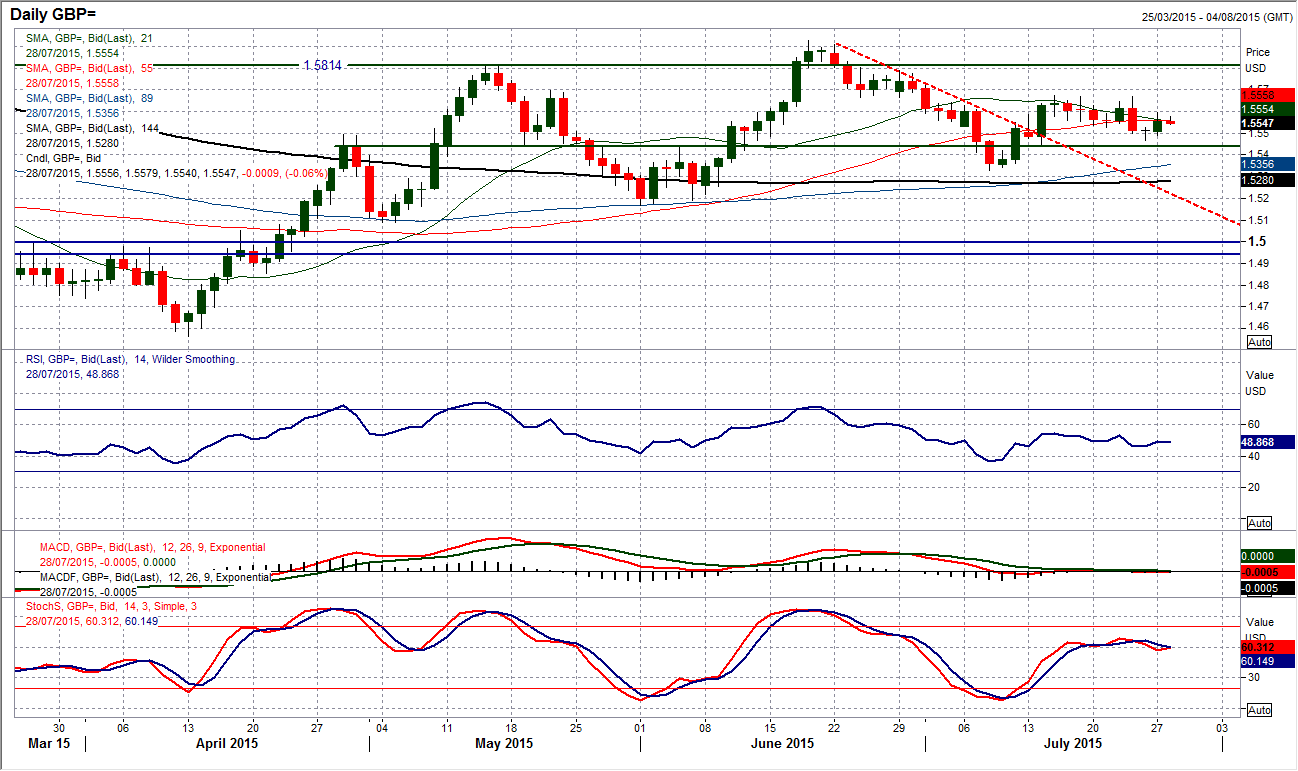
The lack of decisive trading continues on Cable (something that I believe will be a feature of trading in the next few months). The technicals are still buzzing around neutral and there is a lack of direction on the price. There is still a legacy from the bearish engulfing candle from last Thursday, but its importance is waning. The resistance of the pattern comes in at $1.5670. The Fibonacci retracements of $1.5188/$1.5928 continue to act as key near term levels as the 61.8% Fib level at $1.5470 came in as support on Friday, with the resistance still based around the 38.2% level at $1.5645. The pair is very much searching for direction now and this is clear from the hourly RSI which is consistently using the limits of 30/70 which suggests a rangebound play. The FOMC is likely to give us that direction.
USD/JPY
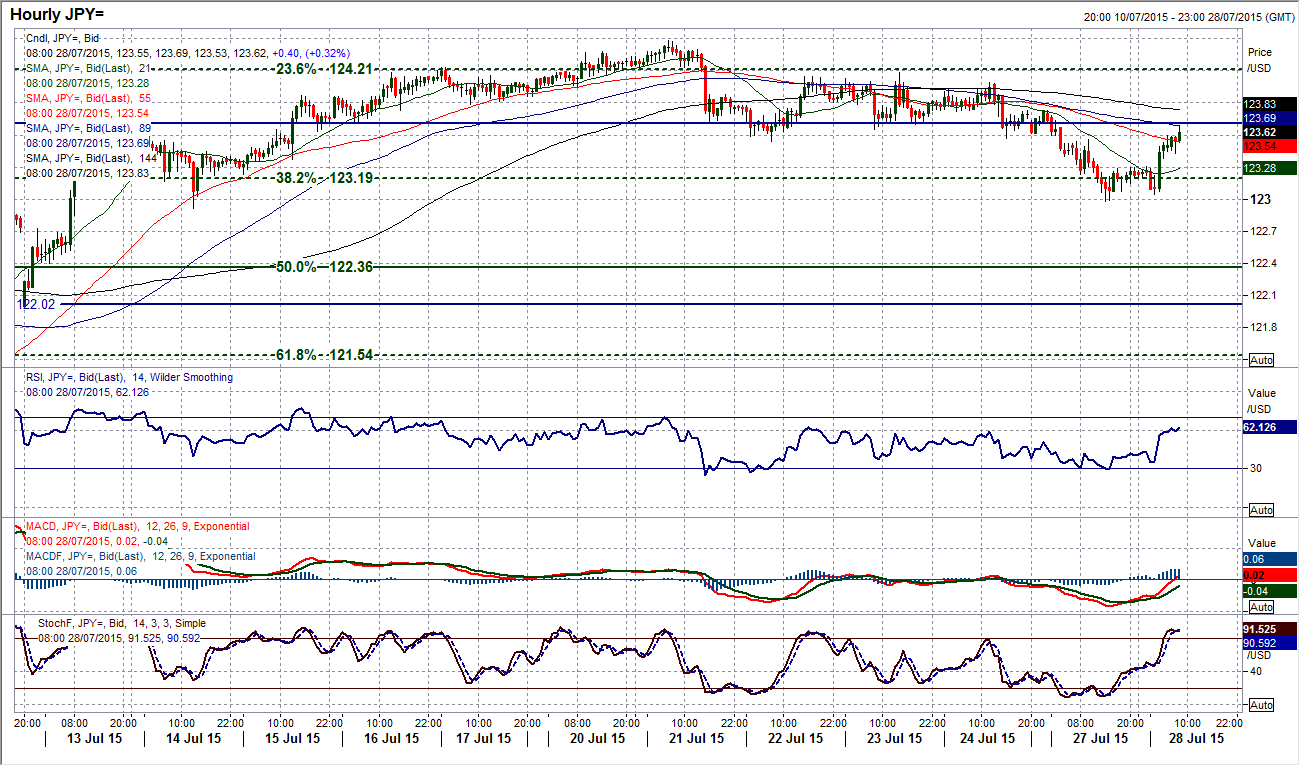
The resistance of the highs around the 23.6% Fibonacci retracement level has pulled the pair back from a bull run towards the outlook of an indecisive trade now. There are several mixed signals on the charts which are rendering this a tough near term call. I have been saying for a few days that I expected a correction back towards the key near term pivot level that has been the 38.2% Fib retracement at 123.20. Now the test of support will really come in. If the bulls are in control then the rebound we have seen overnight will hold and the outlook will remain solid. The Stochastics are on the brink of giving a confirmed sell signal, however the other momentum indicators are still fairly positive. I would look for how the pair reacts to the resistance band around 123.50/123.80 now. Support is currently at 123.00. The intraday hourly chart shows the momentum is quickly unwinding, and if the hourly RSI moves into the high 60s/low 70s then this would suggest the bulls are gaining momentum again. This is still a play that is looking for direction and maybe the FOMC is needed to provide it.
Gold
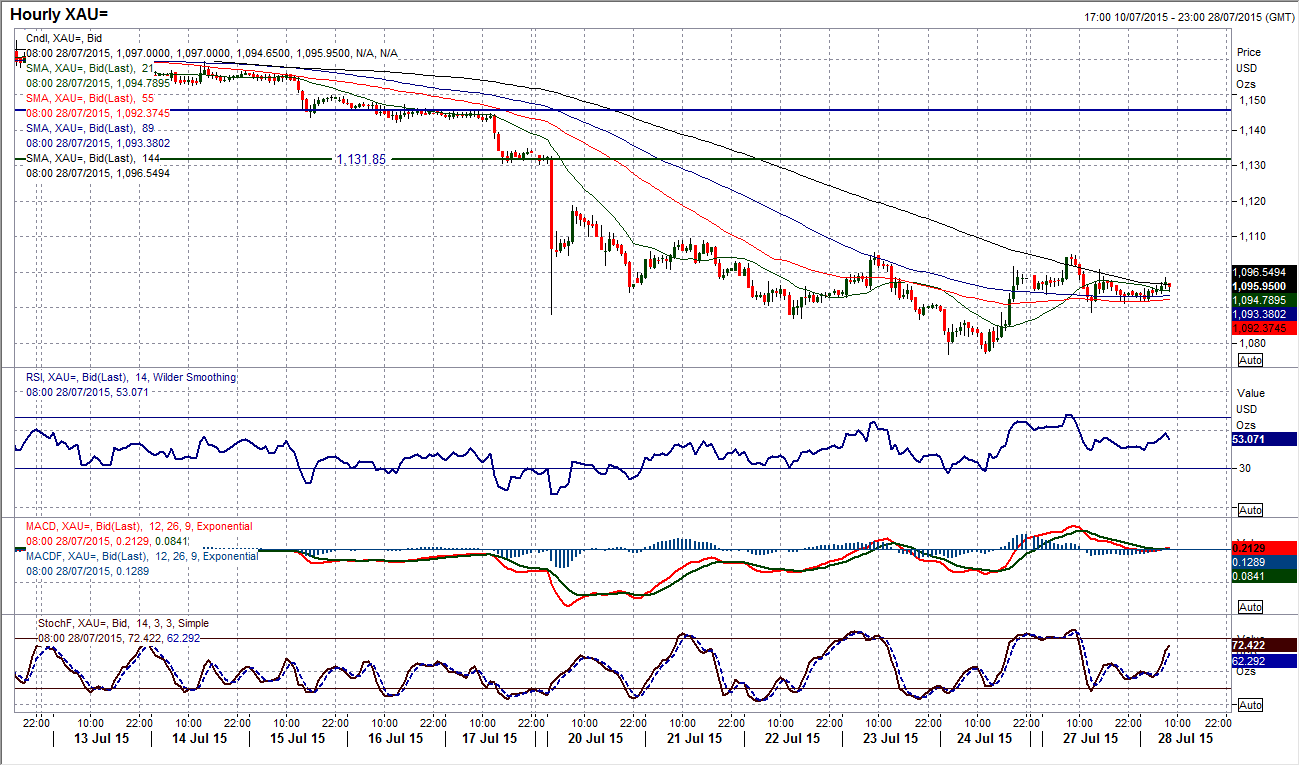
Gold is an interesting chart because for all the bearish predictions that have come since the big breakdown, the price has fluctuated around $1100 for more than a week now. This would suggest a consolidation. The fact that the price has barely bounced at all though in that time and shown little real will to recover could be quite telling. However this consolidation is merely allowing the momentum indicators to unwind from their extreme positions (especially RSI which was below 20). I see this to be settling period before more selling pressure. The intraday hourly chart shows that there has been a series of lower highs in the past 6 days. The resistance is in place at $1109.50 and $1118.70 as the key near term levels. If there were to be a move above $1109.50 then this would have confirmed the broken sequence of lower highs. However for now the rallies (such as yesterday) continue to be sold into and perhaps look to use the hourly RSI into the 60s as a chance to sell for a retest of the low at $1077 once more.
WTI Oil
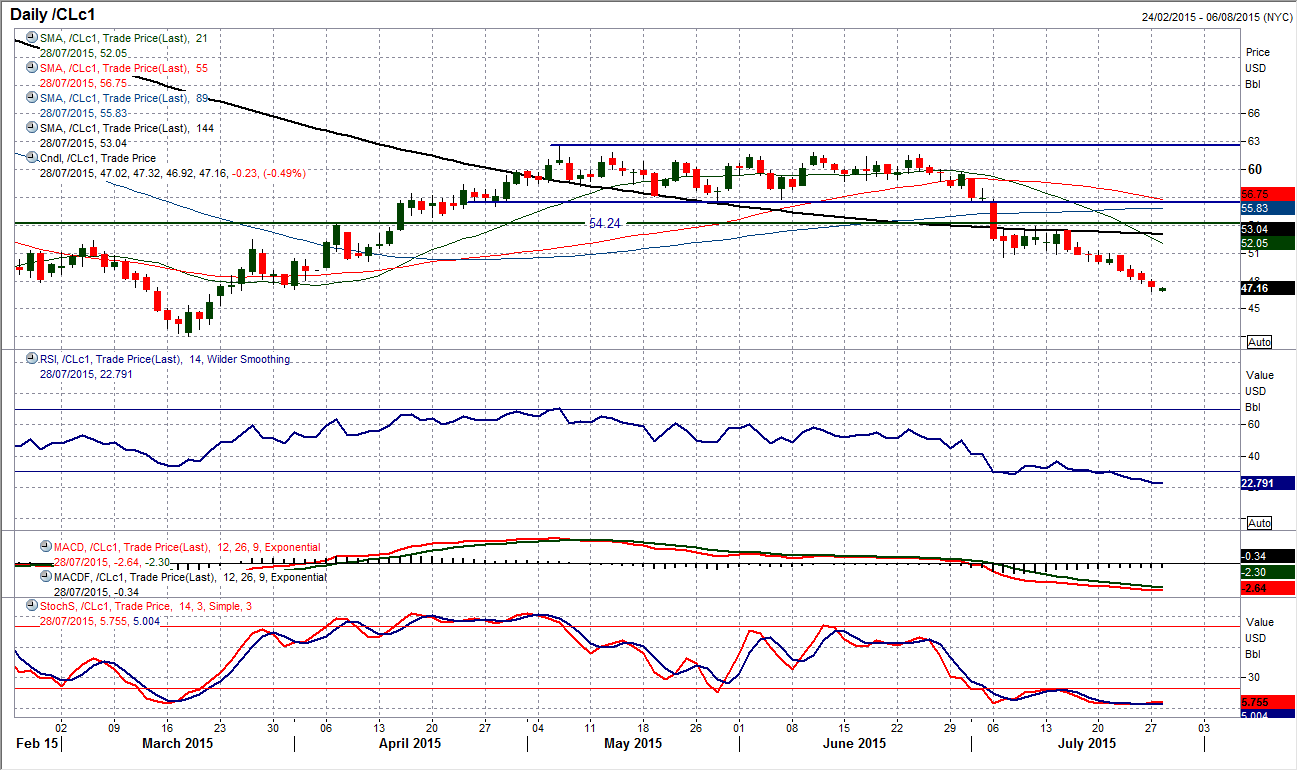
It is almost like death by a thousand cuts for WTI currently as the price continues to fall slowly but steady and has now hit (and looks to be breaking) the key support at $47.00 which was the April low that was left during the rally. Momentum is negative and it is notable that the RSI is now the lowest since January but still has further downside potential (it got to below 20 around the turn of the year. The price has now been falling for 8 of the past 9 sessions. That is not to say that there are not intraday moves that give a chance to sell. It seems to be that frequently in the past couple of weeks there have been intraday rallies that have been pounced upon by the sellers. A confirmed breach of $47.00 would open a potential return to the critical March low at $42.00. The hourly RSI is one way to play this, with rebounds back towards 50 seen as such an opportunity to sell. The hourly chart shows near term resistance at $49.00 and more significantly at $49.60/70. The daily chart shows resistance at $50.60.
Note: All information on this page is subject to change. The use of this website constitutes acceptance of our user agreement. Please read our privacy policy and legal disclaimer. Opinions expressed at FXstreet.com are those of the individual authors and do not necessarily represent the opinion of FXstreet.com or its management. Risk Disclosure: Trading foreign exchange on margin carries a high level of risk, and may not be suitable for all investors. The high degree of leverage can work against you as well as for you. Before deciding to invest in foreign exchange you should carefully consider your investment objectives, level of experience, and risk appetite. The possibility exists that you could sustain a loss of some or all of your initial investment and therefore you should not invest money that you cannot afford to lose. You should be aware of all the risks associated with foreign exchange trading, and seek advice from an independent financial advisor if you have any doubts.
Recommended Content
Editors’ Picks
EUR/USD edges lower toward 1.0700 post-US PCE

EUR/USD stays under modest bearish pressure but manages to hold above 1.0700 in the American session on Friday. The US Dollar (USD) gathers strength against its rivals after the stronger-than-forecast PCE inflation data, not allowing the pair to gain traction.
GBP/USD retreats to 1.2500 on renewed USD strength

GBP/USD lost its traction and turned negative on the day near 1.2500. Following the stronger-than-expected PCE inflation readings from the US, the USD stays resilient and makes it difficult for the pair to gather recovery momentum.
Gold struggles to hold above $2,350 following US inflation

Gold turned south and declined toward $2,340, erasing a large portion of its daily gains, as the USD benefited from PCE inflation data. The benchmark 10-year US yield, however, stays in negative territory and helps XAU/USD limit its losses.
Bitcoin Weekly Forecast: BTC’s next breakout could propel it to $80,000 Premium

Bitcoin’s recent price consolidation could be nearing its end as technical indicators and on-chain metrics suggest a potential upward breakout. However, this move would not be straightforward and could punish impatient investors.
Week ahead – Hawkish risk as Fed and NFP on tap, Eurozone data eyed too

Fed meets on Wednesday as US inflation stays elevated. Will Friday’s jobs report bring relief or more angst for the markets? Eurozone flash GDP and CPI numbers in focus for the Euro.
