![]() LikesMoney
LikesMoney
Independent Analyst
The Dollar:
The dollar formed a swing low on Friday.
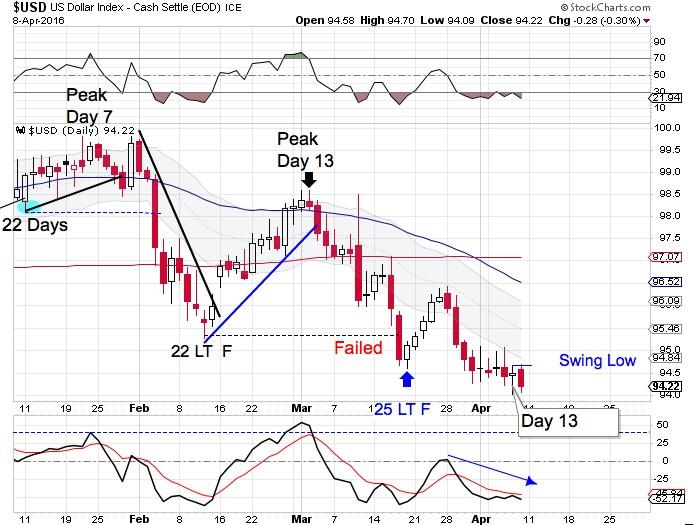
Thursday was day 13 for the daily dollar cycle. That is 5 days shy of the dollar's timing band to print a daily cycle low. So there is still time for another push lower before forming a daily cycle low. The dollar is in a daily down trend. It will remain in a down trend until it can close above the upper daily cycle band.
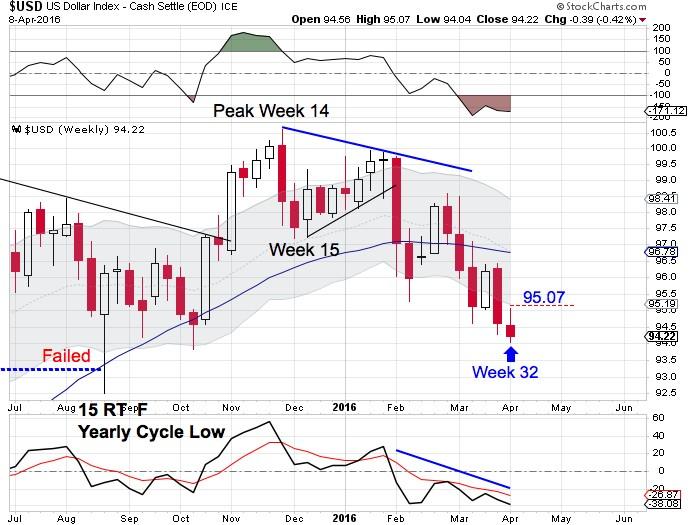
The lower low this week has eased the parameters for forming a weekly swing low. With the dollar deep in its timing band, a swing low will likely mark the intermediate cycle low. A break above 95.07 will form a weekly swing low.
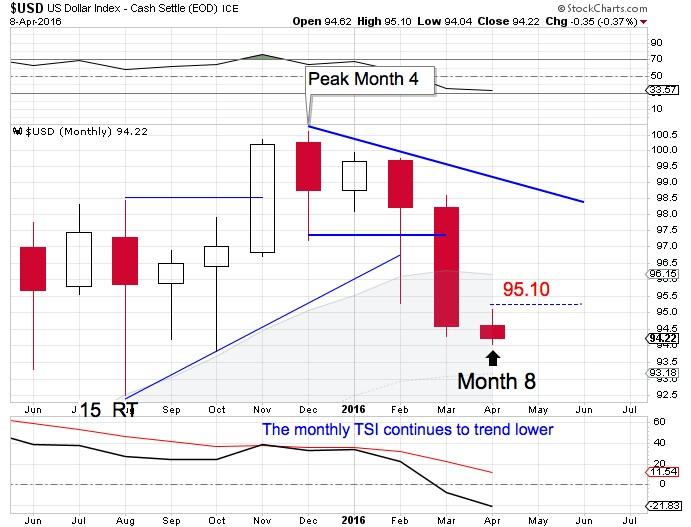
April is month 8 for the yearly dollar cycle. This places the dollar in its timing band to form a yearly cycle low. Since April printed a lower low, the earliest a monthly swing low can form is in May. Then a break above the declining monthly trend line will confirm that April hosted the yearly cycle low.
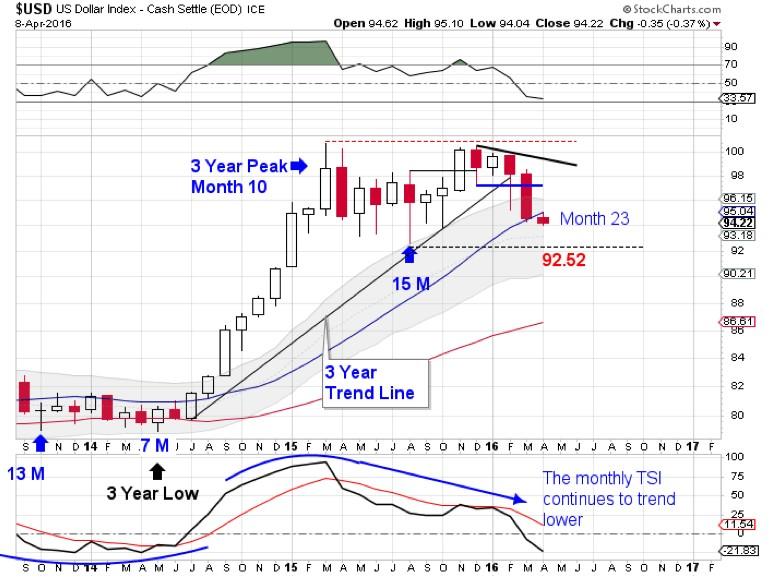
The 3 year cycle peaked back on month 10. April is month 23 for the 3 year dollar cycle. February’s break of the 3 year trend line indicates that the dollar has begun its 3 year cycle decline. A failed yearly cycle is required to complete the 3 year cycle decline. Currently a break below 92.52 will form a failed yearly cycle.
However if April forms a yearly cycle low, that will ease the parameters for forming a failed yearly cycle. If a new yearly cycle is confirmed, by a break above the declining monthly trend line, then a break below April’s low will form a failed yearly cycle. The dollar’s 3 year cycle averages about 36 months. So if April is the yearly cycle low, allowing 10 – 12 months would then bring the dollar to months 33 – 35, which is right in the timing band for a 3 year cycle low.
Stocks:
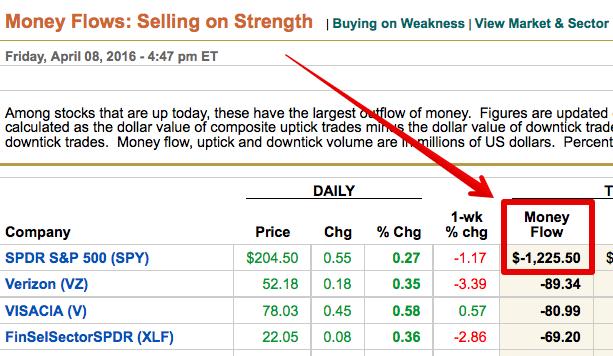
Friday's huge Selling on Strength number indicates that stocks still need to complete their daily cycle decline.
Stocks remain above the upper daily cycle band, indicating a daily uptrend.
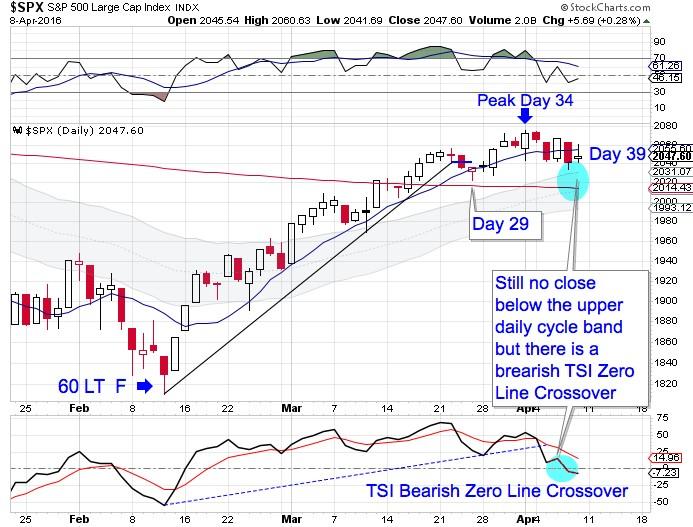
Following the day 29 swing low, stocks went on to print a higher high on day 34. A swing high formed on day 36 that coincided with a TSI trend line break. The True Strength Indicator then delivered a bearish zero line crossover on Friday which indicates the daily cycle decline is imminent.
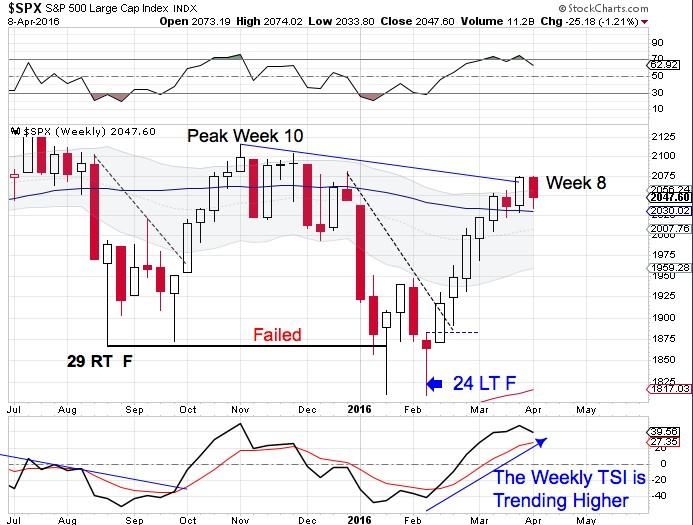
Stocks broke above the declining weekly trend line on week 7 delivering our first signal that February hosted the yearly cycle low. We would like to see more bullish follow through to confirm this.
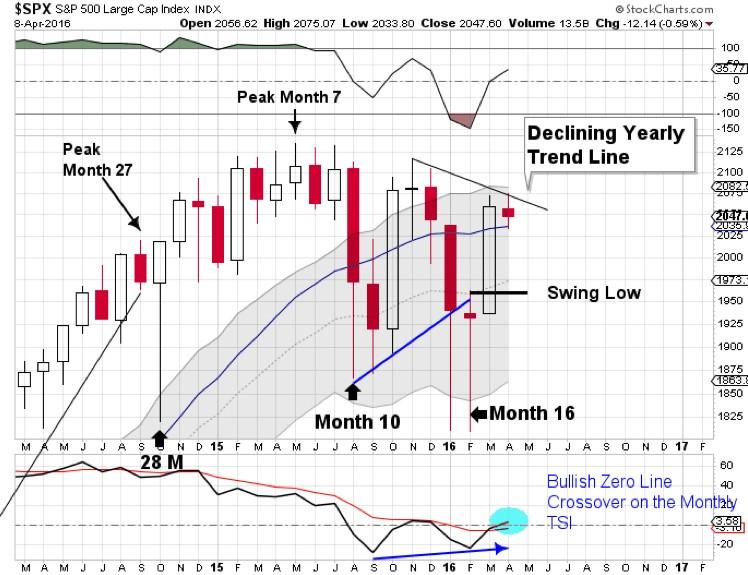
Stocks printed their lowest point in February. A monthly swing low formed in March and currently stocks are testing the declining monthly trend line. A clear and convincing break of the declining monthly trend line will confirm that February hosted the yearly cycle low, and possibly the 7 year cycle low.
Note: All information on this page is subject to change. The use of this website constitutes acceptance of our user agreement. Please read our privacy policy and legal disclaimer. Opinions expressed at FXstreet.com are those of the individual authors and do not necessarily represent the opinion of FXstreet.com or its management. Risk Disclosure: Trading foreign exchange on margin carries a high level of risk, and may not be suitable for all investors. The high degree of leverage can work against you as well as for you. Before deciding to invest in foreign exchange you should carefully consider your investment objectives, level of experience, and risk appetite. The possibility exists that you could sustain a loss of some or all of your initial investment and therefore you should not invest money that you cannot afford to lose. You should be aware of all the risks associated with foreign exchange trading, and seek advice from an independent financial advisor if you have any doubts.
Recommended Content
Editors’ Picks
EUR/USD edges lower toward 1.0700 post-US PCE

EUR/USD stays under modest bearish pressure but manages to hold above 1.0700 in the American session on Friday. The US Dollar (USD) gathers strength against its rivals after the stronger-than-forecast PCE inflation data, not allowing the pair to gain traction.
GBP/USD retreats to 1.2500 on renewed USD strength

GBP/USD lost its traction and turned negative on the day near 1.2500. Following the stronger-than-expected PCE inflation readings from the US, the USD stays resilient and makes it difficult for the pair to gather recovery momentum.
Gold struggles to hold above $2,350 following US inflation

Gold turned south and declined toward $2,340, erasing a large portion of its daily gains, as the USD benefited from PCE inflation data. The benchmark 10-year US yield, however, stays in negative territory and helps XAU/USD limit its losses.
Bitcoin Weekly Forecast: BTC’s next breakout could propel it to $80,000 Premium

Bitcoin’s recent price consolidation could be nearing its end as technical indicators and on-chain metrics suggest a potential upward breakout. However, this move would not be straightforward and could punish impatient investors.
Week ahead – Hawkish risk as Fed and NFP on tap, Eurozone data eyed too

Fed meets on Wednesday as US inflation stays elevated. Will Friday’s jobs report bring relief or more angst for the markets? Eurozone flash GDP and CPI numbers in focus for the Euro.