![]() Nick Mastrandrea
Nick Mastrandrea
Market Tea Leaves
Good Morning Traders,
As of this writing 3:50 AM EST, here’s what we see:
US Dollar: Down at 92.130 the US Dollar is down 488 ticks and trading at 92.130.
Energies: June Crude is up at 45.24.
Financials: The June 30 year bond is up 11 ticks and trading at 162.17.
Indices: The June S&P 500 emini ES contract is down 23 ticks and trading at 2068.50.
Gold: The June gold contract is trading up at 1300.70. Gold is 49 ticks higher than its close.
Initial Conclusion
This is not a correlated market. The dollar is down- and crude is up+ which is normal but the 30 year bond is trading higher. The Financials should always correlate with the US dollar such that if the dollar is lower then bonds should follow and vice-versa. The indices are down and Crude is trading higher which is correlated. Gold is trading up which is correlated with the US dollar trading down. I tend to believe that Gold has an inverse relationship with the US Dollar as when the US Dollar is down, Gold tends to rise in value and vice-versa. Think of it as a seesaw, when one is up the other should be down. I point this out to you to make you aware that when we don’t have a correlated market, it means something is wrong. As traders you need to be aware of this and proceed with your eyes wide open.
Asia traded mainly lower with the exception of the Shanghai exchange which traded higher. As of this writing all of Europe is trading lower.
Possible Challenges To Traders Today
– IBD/TIPP Economic Optimism is out at 10 AM EST. This is major.
– FOMC Member Mester Speaks at 10:30 AM EST. This is major.
– Total Vehicle Sales. This is major.
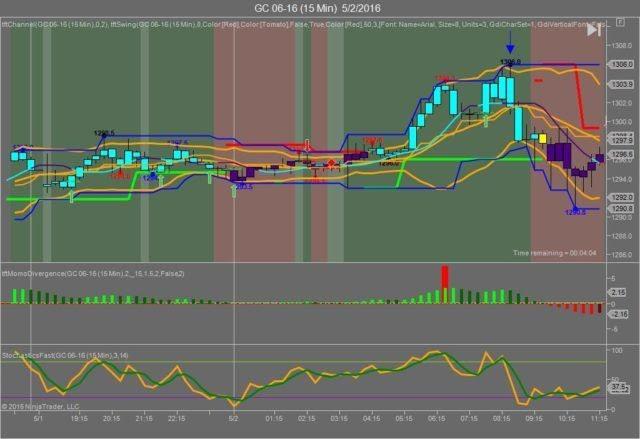
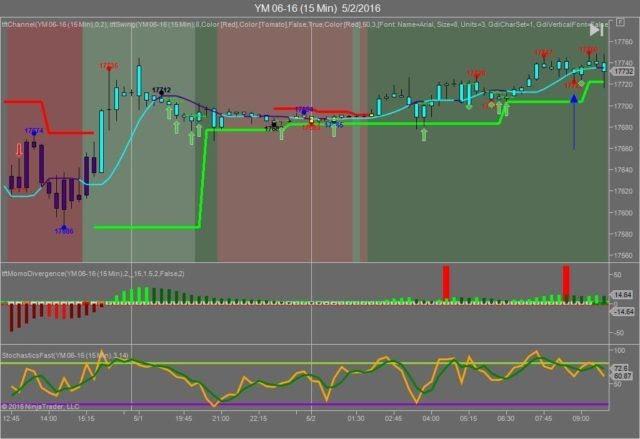
Gold
We’ve elected to switch gears a bit and show correlation between Gold and The YM futures contract. The YM contract is the DJIA and the purpose is to show reverse correlation between the two instruments. Remember it’s liken to a seesaw, when up goes up the other should go down and vice versa.
Yesterday Gold made it’s move at around 8:30 AM EST with no economic news in sight. The YM hit a low at around that time and Gold hit a high. If you look at the charts below the YM gave a signal at around 8;30 AM EST, while Gold also gave a signal at just about the same time. Look at the charts below and you’ll see a pattern for both assets. The YM hit a low at around 8:30 AM EST and Gold hit a high. These charts represent the latest version of Trend Following Trades and I’ve changed the timeframe to a 15 minute chart to display better. This represented a shorting opportunity on Gold, as a trader you could have netted about 50 plus ticks per contract on this trade. Each tick is worth $10. We added a Donchian Channel to the charts to show the signals more clearly.
Charts Courtesy of Trend Following Trades built on a NinjaTrader platform
Bias
Yesterday we gave the markets a neutral bias as the futures didn’t seem to have any sense of direction. A neutral bias means the markets could go in any direction. The Dow closed higher by 118 points and the other indices gained ground as well. Today we aren’t dealing with a correlated market and our bias is to the downside.
Could this change? Of Course. Remember anything can happen in a volatile market.
Commentary
Yesterday we gave the markets a neutral bias as the futures didn’t have any direction yesterday morning. ISM Manufacturing PMI and Construction Spending came out and failed to inspire, however ISM Manufacturing Prices far exceeded expectation and the markets took off and didn’t look back throughout yesterday’s session. The question in our minds is was this predicated upon Manufacturing Prices or was this a dead cat bounce. A dead cat bounce is a situation where the market’s been down for so long and then all of a sudden, out of nowhere it takes off for no apparent reason. Typically this means that the Smart Money has gotten into the act and decided to pump up the markets by putting money on the table. It usually means the markets gain for more than one session, so we’ll have to monitor and see…
Trading performance displayed herein is hypothetical. The following Commodity Futures Trading Commission (CFTC) disclaimer should be noted.
Hypothetical performance results have many inherent limitations, some of which are described below. No representation is being made that any account will or is likely to achieve profits or losses similar to those shown.
In fact, there are frequently sharp differences between hypothetical performance results and the actual results subsequently achieved by any particular trading program. One of the limitations of hypothetical performance trading results is that they are generally prepared with the benefit of hindsight.
In addition, hypothetical trading does not involve financial risk, and no hypothetical trading record can completely account for the impact of financial risk in actual trading. For example, the ability to withstand losses or to adhere to a particular trading program in spite of trading losses are material points which can also adversely affect actual trading results.
There are numerous other factors related to the markets in general or to the implementation of any specific trading program which cannot be fully accounted for in the preparation of hypothetical performance results and all of which can adversely affect actual trading results.
Trading in the commodities markets involves substantial risk and YOU CAN LOSE A LOT OF MONEY, and thus is not appropriate for everyone. You should carefully consider your financial condition before trading in these markets, and only risk capital should be used.
In addition, these markets are often liquid, making it difficult to execute orders at desired prices. Also, during periods of extreme volatility, trading in these markets may be halted due to so-called “circuit breakers” put in place by the CME to alleviate such volatility. In the event of a trading halt, it may be difficult or impossible to exit a losing position.
Recommended Content
Editors’ Picks
EUR/USD holds below 1.0750 ahead of key US data

EUR/USD trades in a tight range below 1.0750 in the European session on Friday. The US Dollar struggles to gather strength ahead of key PCE Price Index data, the Fed's preferred gauge of inflation, and helps the pair hold its ground.
GBP/USD consolidates above 1.2500, eyes on US PCE data

GBP/USD fluctuates at around 1.2500 in the European session on Friday following the three-day rebound. The PCE inflation data for March will be watched closely by market participants later in the day.
Gold clings to modest daily gains at around $2,350

Gold stays in positive territory at around $2,350 after closing in positive territory on Thursday. The benchmark 10-year US Treasury bond yield edges lower ahead of US PCE Price Index data, allowing XAU/USD to stretch higher.
Bitcoin Weekly Forecast: BTC’s next breakout could propel it to $80,000 Premium

Bitcoin’s recent price consolidation could be nearing its end as technical indicators and on-chain metrics suggest a potential upward breakout. However, this move would not be straightforward and could punish impatient investors.
US core PCE inflation set to signal firm price pressures as markets delay Federal Reserve rate cut bets

The core PCE Price Index, which excludes volatile food and energy prices, is seen as the more influential measure of inflation in terms of Fed positioning. The index is forecast to rise 0.3% on a monthly basis in March, matching February’s increase.