Answer: no. Yesterday’s “Big Picture” was entitled, “A pause in Iraq?” The answer to that question came quickly, and the answer is: no, there’s no pause at all. It was reported yesterday that the Syrian air force bombed the Iraqi city of Qaim in a strike against the insurgent forces, the Islamic State in Iraq and the Levant (ISIS). The news derailed a rally in the equity market and caused oil to spike back up.
The dollar’s oil betas that we published yesterday turned out to be a mixed guide to the reaction in the FX market. RUB was indeed the biggest gainer, as the betas predicted, although that may have had more to do with news of a cease-fire in Ukraine than with the oil market. The dollar was unchanged vs NOK and actually rose vs CAD and MXN, contrary to what the betas would suggest. CZK did rally though, oddly enough. On the other side of the trade, HUF and TRY did indeed decline, but that may have been due more to the interest rate cuts in those two countries than the rebound in oil prices. CHF gained and JPY was almost unchanged, which go against the predictions of the betas. So we see that while the betas may be a guide to general movements over time, they cannot be expected to provide a certain guide for daily movements.
It was notable too that WTI rose more than Brent did yesterday. A good part of the rise may be due to a story that ran in the Wall Street Journal saying that the US government is likely to relax further the restrictions on exporting some kinds of ultra-light oil that have been processed in certain ways. Almost all exports of oil from the US are banned, but there is growing pressure for these restrictions to be relaxed as US oil production rises. That would help to lift the price of WTI closer to Brent, which is now around $7.50 a barrel more expensive.
Despite the renewed tensions in Iraq, volatility remains quite low. Every morning when I start work I record the levels of a number of currencies. Over the last 10 working days, the opening quote for USD/JPY has been between 101.85 and 102.20. I can remember days when that would have been the bid-offer spread. The “old” VIX index, the VIX index based on the S&P 100, which has a history going back to 1986, hit a record low yesterday.
Among the G10 currencies, the biggest mover over the last 24 hours was AUD, which fell sharply after the Australian government’s Bureau of Resources and Energy Economics cut its price estimate for iron ore for this year to USD 105/ton from USD 110/ton forecast in March. It also lowered its forecast for prices in 2015 to USD 97 from USD 103. Even these forecasts seem optimistic as the recent price is around USD 93. I expect falling commodity prices to continue to depress Australia’s terms of trade and weaken the currency further.
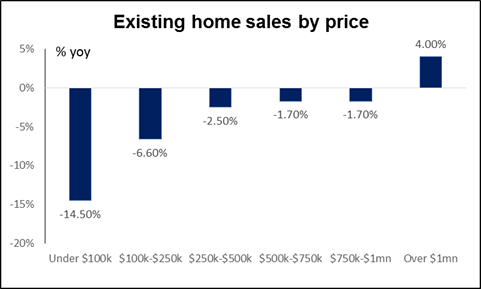
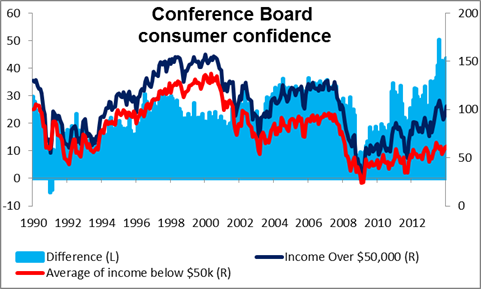
The US economic data out was generally good. New home sales rose more than expected, hitting the highest level since before the Lehman Bros. crash, and continuing the good news from Tuesday’s existing home sales. The Conference Board’s index of US consumer confidence for June also rose more than expected, in contrast to the U of Michigan’s decline, and it too is at a post-crash high. One notable point about these indicators though is the split between income groups. Looking at Tuesday’s existing home sales, for example, sales of homes costing less than $1mn were down yoy while only sales of homes above $1mn rose. As for consumer confidence, the gap between people making less than $50k a year and more than $50k a year remains around the highest it’s been since the data began in 1989. The US (like many countries) has a two-tier economy, which may be one reason why some of the economic data is difficult to interpret: the overall numbers can mask significant internal discrepancies because they refer to two different realities.
During the European day, the only data we get are manufacturing confidence data from France and Italy’s consumer confidence figure, both for June.
From the US, we have the third estimate of GDP for Q1 which is expected to decline at a -1.8% qoq SAAR pace, a downward revision from the second estimate of -1.0% qoq. Durable goods orders for May are also expected. The headline figure is forecast to remain unchanged on a mom basis from a downwardly revised +0.6% mom the previous month, while durable goods excluding transportation equipment are estimated to have risen at the same pace on a mom basis, after April’s figure was revised up to 0.3% mom. The Markit service-sector PMI for June is expected to remain unchanged. Overall these figures are not so good. The dollar could weaken slightly if they come in as expected.
We have five speakers on Wednesday’s agenda. RBA Deputy Governor Philip, three ECB Governing Council members -- Carlos Costa, Luis Maria Linde and Jens Weidmann – and San Francisco Fed President John Williams speak.
THE MARKET
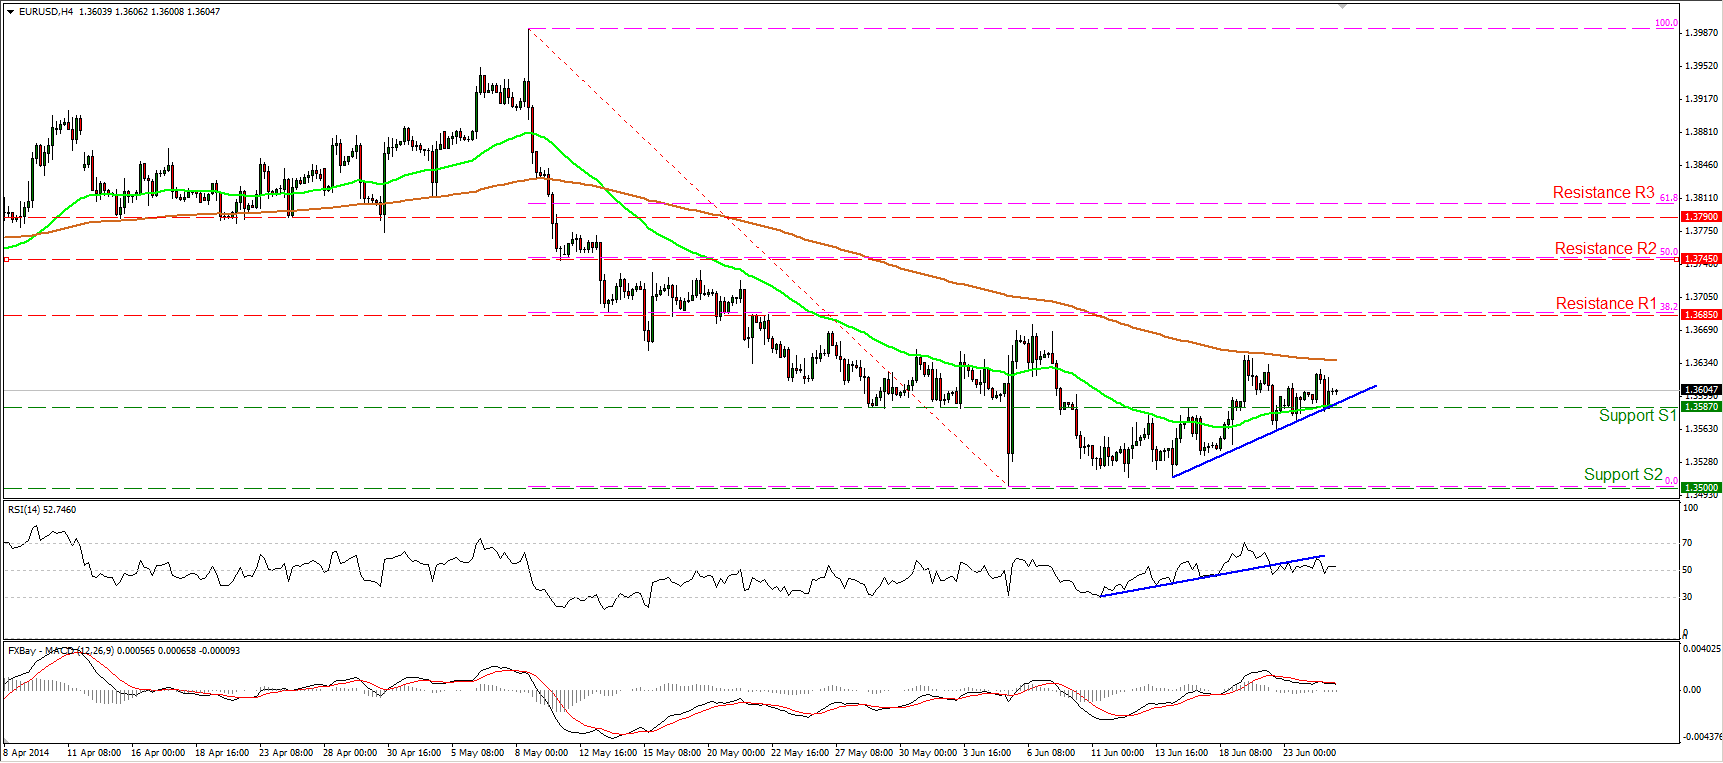
EUR/USD capped by the 200-period MA
EUR/USD moved in a consolidative mode, remaining between the support bar of 1.3587 (S1) and the 200-period moving average. The RSI stayed below its prior uptrend line, near its neutral level, while the MACD, although in its positive territory, remains below its trigger line. Given that, I would maintain my neutral stance for now. A price dip below the blue short-term support line may confirm the weakness signs provided by our momentum studies and target the psychological zone of 1.3500 (S2). In the bigger picture, the pair is trading below the 200-day moving average, keeping the long-term outlook negative. However, we need a dip below 1.3500 (S2) to reinforce the downtrend.
Support: 1.3587 (S1), 1.3500 (S2), 1.3475 (S3).
Resistance: 1.3685 (R1), 1.3745 (R2), 1.3790 (R3).
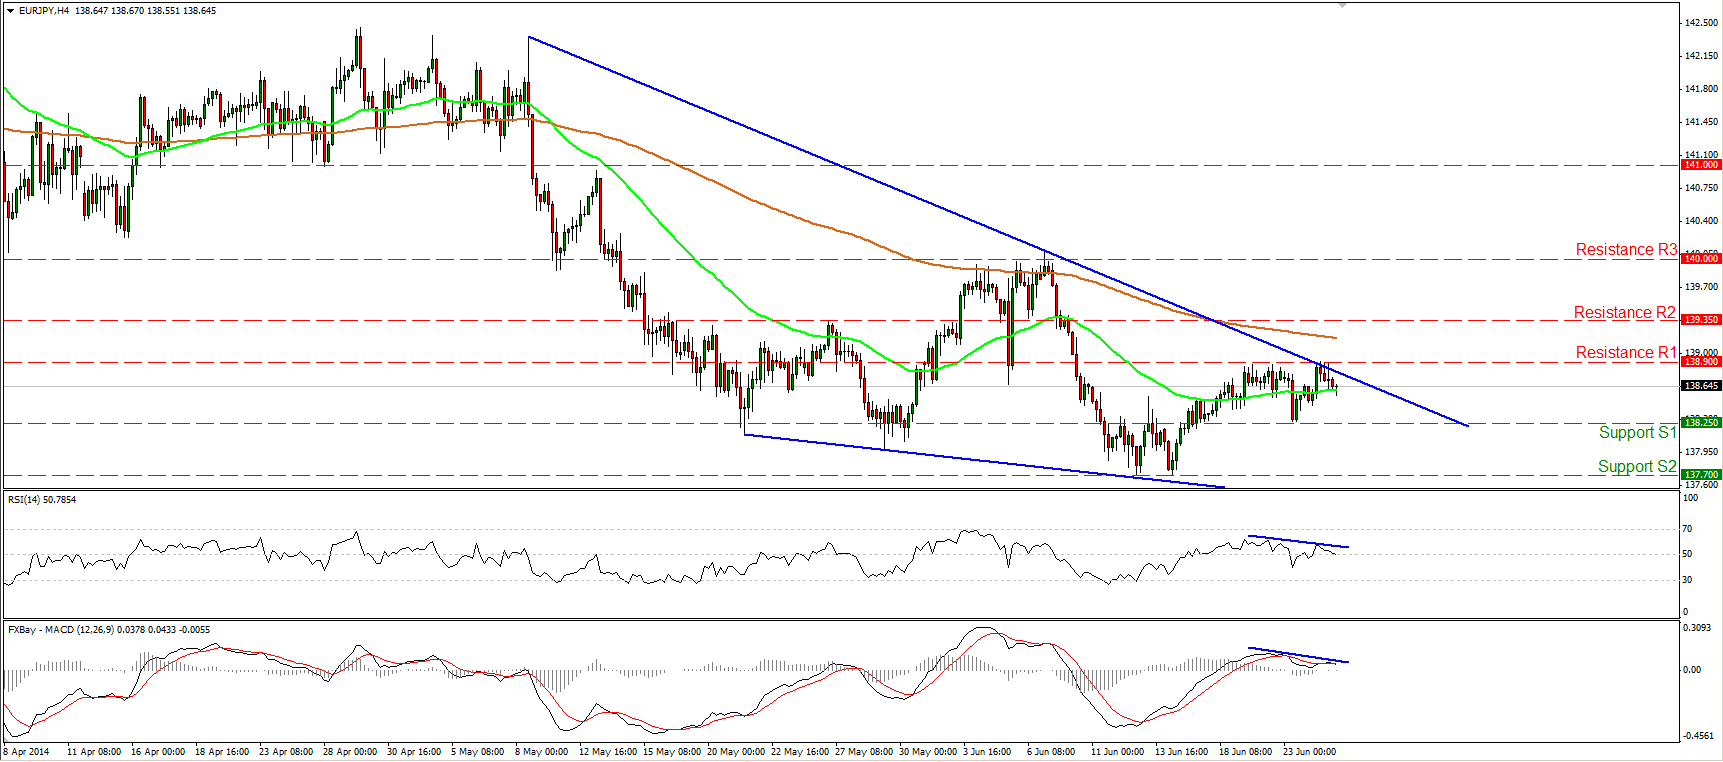
EUR/JPY hits the upper bound of the wedge
EUR/JPY moved slightly higher to hit the upper boundary of the falling wedge formation. Seeing minor-term negative divergence between our momentum studies and the price action, I cannot rule out some consolidation or a pullback within the formation. However, as long as the rate is trading within the wedge, I would maintain my neutral stance. Only a decisive move out of the pattern could give clearer indications about the pair’s forthcoming direction.
Support: 138.25 (S1), 137.70 (S2), 100.80 (S3).
Resistance: 138.90 (R1), 138.25 (R2), 140.00 (R3).
GBP/USD back below 1.7000
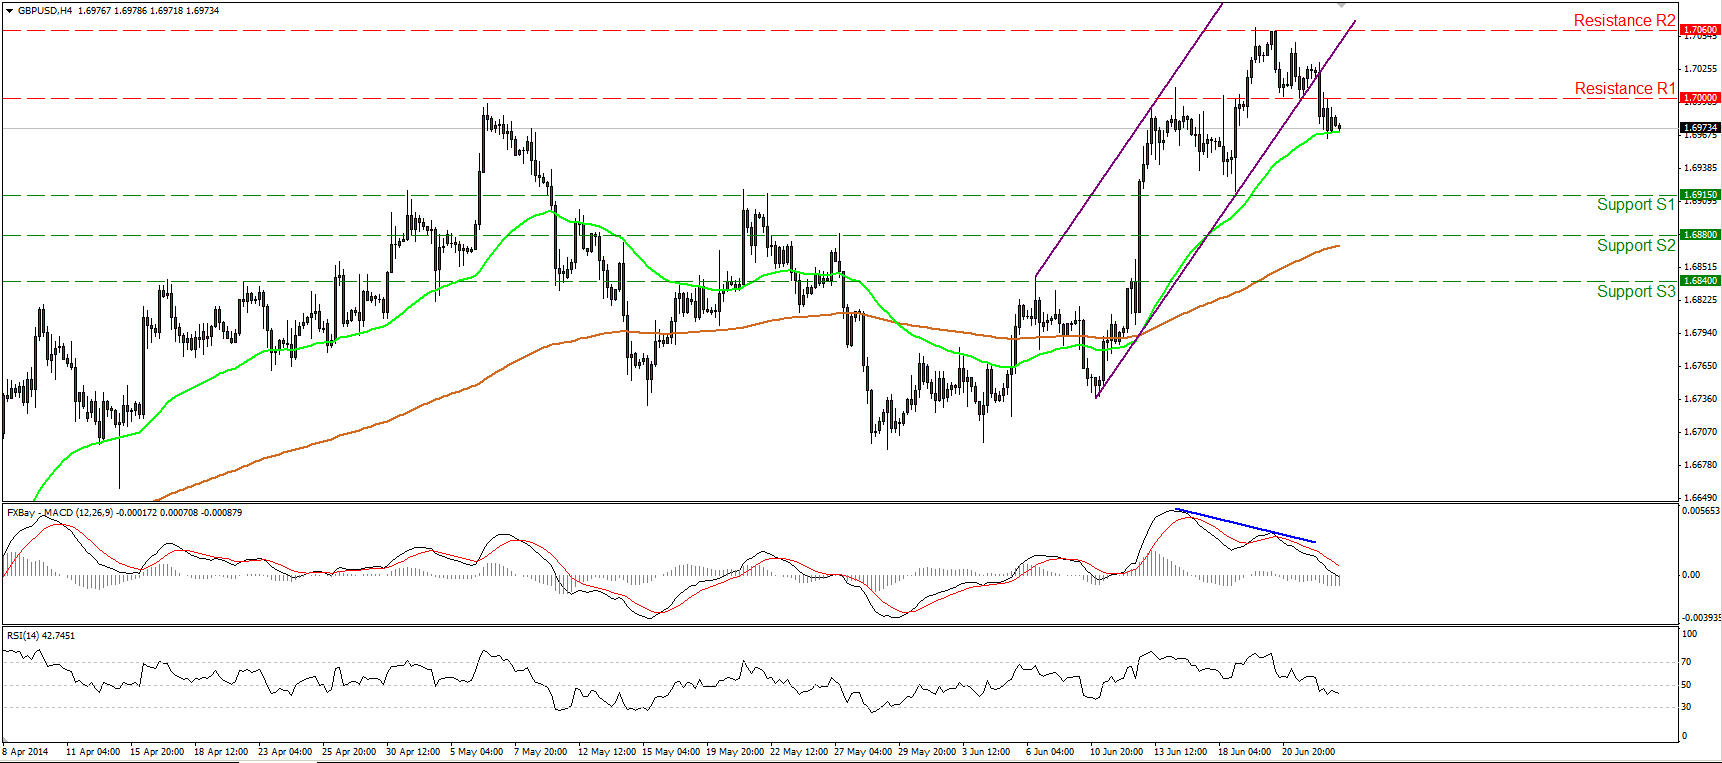
GBP/USD tumbled on Tuesday, falling below the lower bound of the purple upside channel and back below the 1.7000 (R1) barrier, and also confirming the negative divergence between the MACD and the price action. Considering that the MACD, already below its signal line, crossed below its zero line, I would expect the decline to continue, maybe towards the 1.6915 (S1) support zone. However, it’s too early to argue for a trend reversal since we need to see a dip below 1.6915 (S1) to have a forthcoming lower low.
Support: 1.6915 (S1), 1.6880 (S2), 1.6840 (S3).
Resistance: 1.7000 (R1), 1.7060 (R2), 1.7100 (R3).
Gold finds resistance at 1325
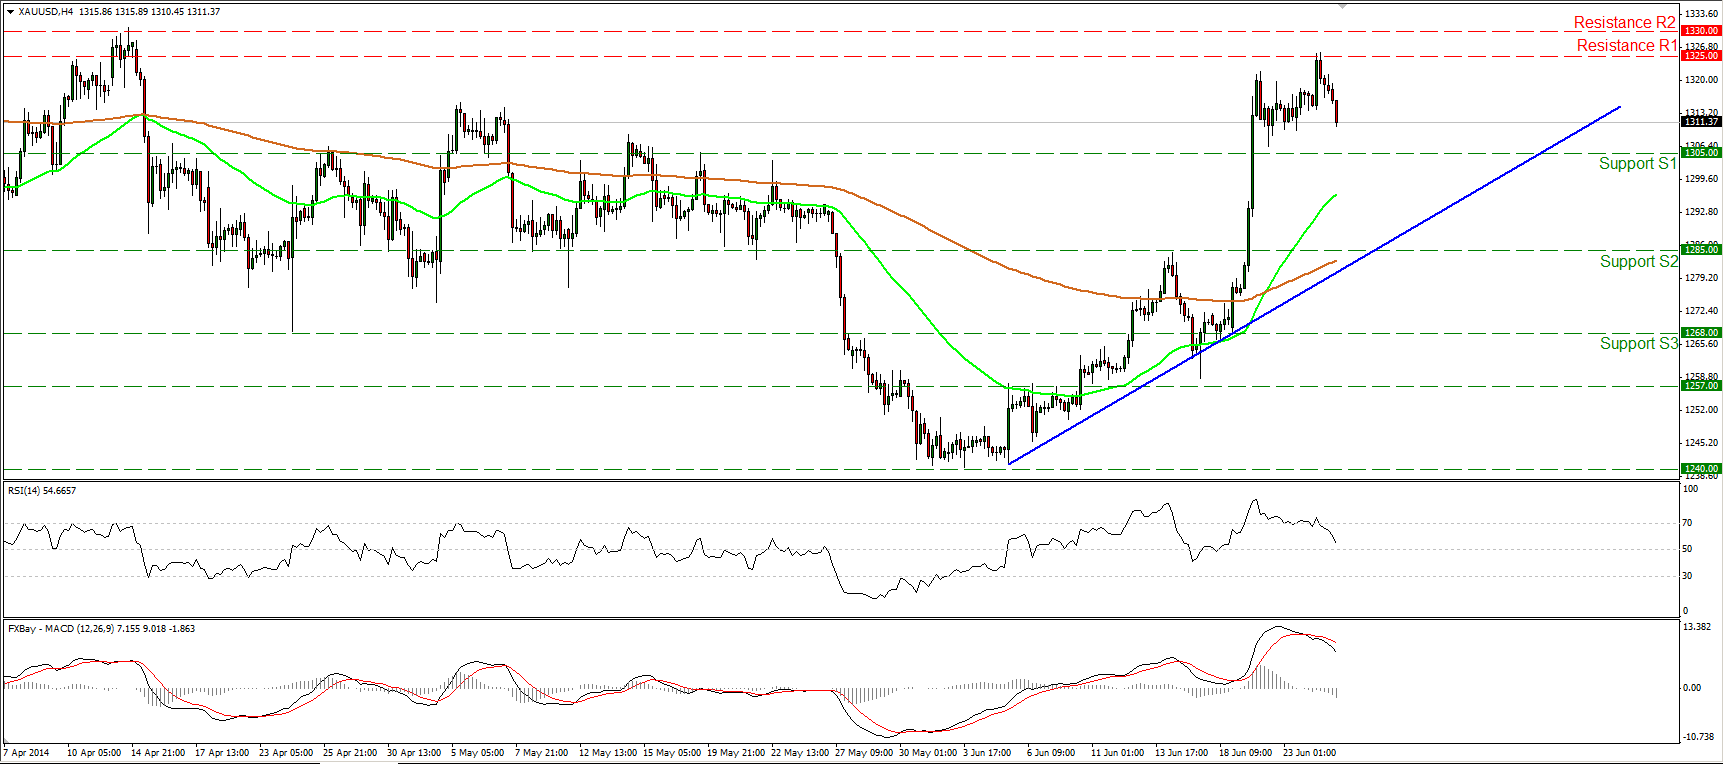
Gold tried to edge higher on Tuesday, but met resistance at 1325 (R1) and then moved lower. The RSI exited overbought conditions, while the MACD remains below its signal line, pointing down. Moreover, on the daily chart, we can identify a shooting star candle, increasing the likelihood for the continuation of the decline. However, as long as the precious metal’s price pattern is higher highs and higher lows above both the moving averages, the technical picture remains positive and I would consider any further declines as a corrective wave, at least for now.
Support: 1305 (S1), 1285 (S2), 1268 (S3).
Resistance: 1325 (R1), 1330 (R2), 1342 (R3).
WTI oscillates between 105.10 and 107.35
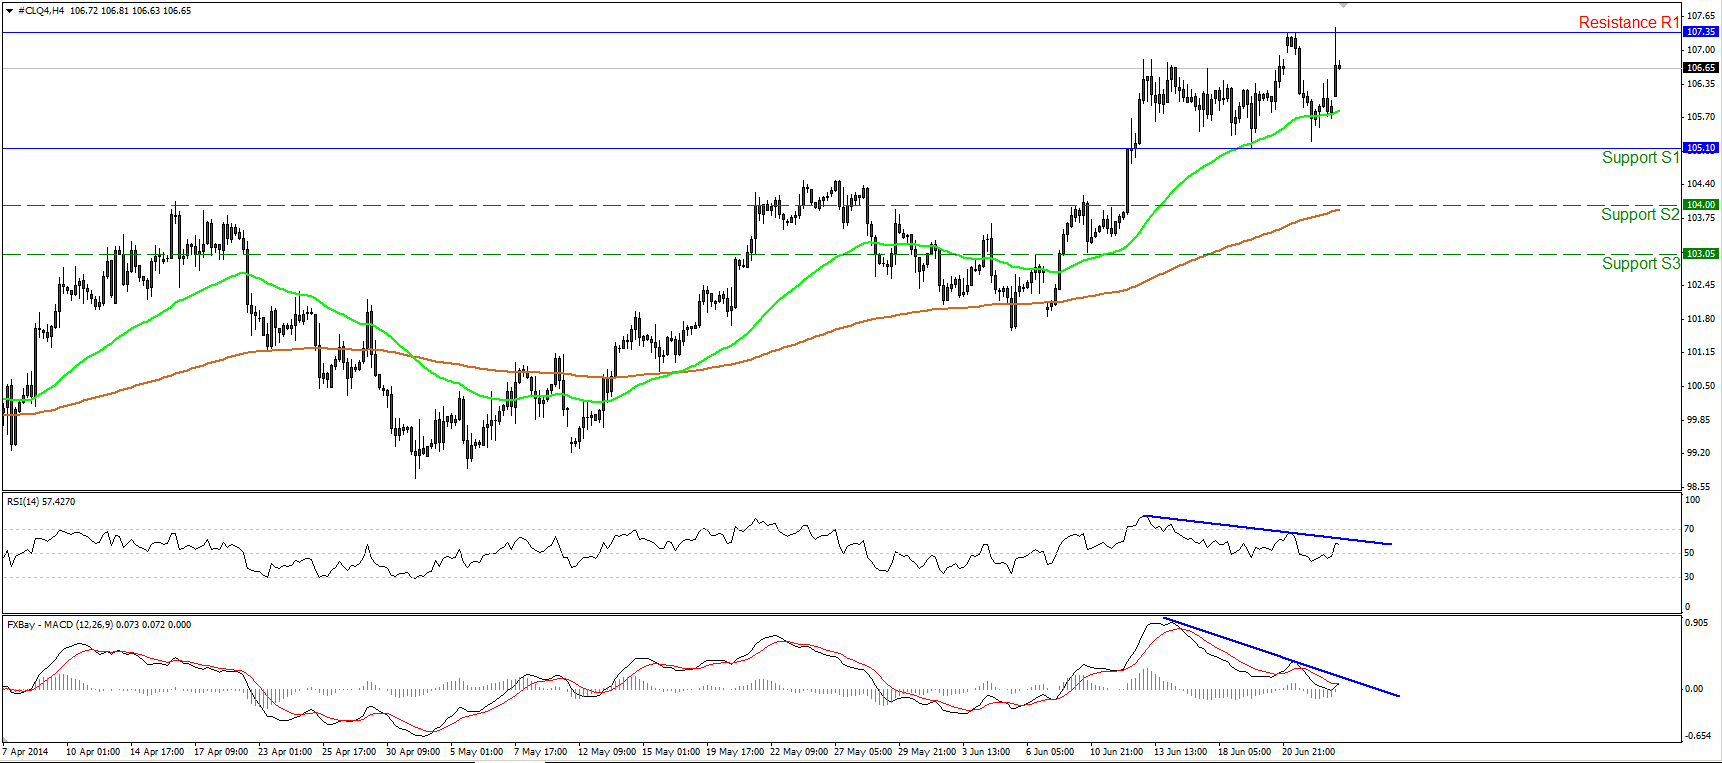
WTI moved significantly higher after finding support slightly above the 105.10 (S1) zone. Nonetheless, the advance was halted by the 107.35 (R1) resistance. Considering that WTI formed two lows near the 105.10 (S1) support and two peaks near 107.35 (R1), I would consider the new path of WTI to be to the sideways. The negative divergence between our momentum studies and the price action is still in effect, but the price is still trading above both the 50- and the 200-period moving averages. Given the aforementioned mixed signals, I consider the short-term outlook to be neutral. A decisive exit from the sideways path may provide more clues about the forthcoming directional movement of WTI.
Support: 105.10 (S1), 104.00 (S2), 103.05 (S3).
Resistance: 107.35 (R1), 108.00 (R2), 110.00 (R3).
Recommended Content
Editors’ Picks
EUR/USD edges lower toward 1.0700 post-US PCE

EUR/USD stays under modest bearish pressure but manages to hold above 1.0700 in the American session on Friday. The US Dollar (USD) gathers strength against its rivals after the stronger-than-forecast PCE inflation data, not allowing the pair to gain traction.
GBP/USD retreats to 1.2500 on renewed USD strength

GBP/USD lost its traction and turned negative on the day near 1.2500. Following the stronger-than-expected PCE inflation readings from the US, the USD stays resilient and makes it difficult for the pair to gather recovery momentum.
Gold struggles to hold above $2,350 following US inflation

Gold turned south and declined toward $2,340, erasing a large portion of its daily gains, as the USD benefited from PCE inflation data. The benchmark 10-year US yield, however, stays in negative territory and helps XAU/USD limit its losses.
Bitcoin Weekly Forecast: BTC’s next breakout could propel it to $80,000 Premium

Bitcoin’s recent price consolidation could be nearing its end as technical indicators and on-chain metrics suggest a potential upward breakout. However, this move would not be straightforward and could punish impatient investors.
Week ahead – Hawkish risk as Fed and NFP on tap, Eurozone data eyed too

Fed meets on Wednesday as US inflation stays elevated. Will Friday’s jobs report bring relief or more angst for the markets? Eurozone flash GDP and CPI numbers in focus for the Euro.
