Market Overview
Is this the big turnaround and can it be trusted? That is the question traders will be asking themselves this morning. What was the trigger? Was it Mario Draghi seemingly promising more stimulus? For me, Draghi offered the market nothing that it was not already expecting, his jawboning lower of the euro is almost becoming like clockwork now. However there has been a significant improvement in sentiment overnight. With oil rallying sharply off its lows and bouncing strongly above $30 this morning, it is amazing what a change of front month futures contract has done for the black stuff. Markets have been absolutely pummelled in recent weeks and any sign of a reversal of that could now produce an almighty short squeeze. There are key markets to watch in this. Dollar/Yen improving above 118.75 is one such example. However, taking a step back, nothing has changed fundamentally in the past 24 hours, and this may be a near term low as short positions unwind. I would be surprised if there is any real buying behind any rebound in these markets.
After Wall Street posted modest gains last night, with the S&P 500 up 0.5%, Asian markets have surged higher overnight with the Nikkei up almost 6%. The European markets are also bouncing today, but the oil price will certainly be a key barometer for how market sentiment moves. A continuation of the rally in oil could drive further unwinding of short positions and pull markets higher. In forex, we can see the improvement in risk, albeit rather smaller than perhaps it could be. The usual risk-on moves are being seen, with the euro and the yen lower, whilst commodity currencies are stronger. We are also seeing interesting improvement in sterling. The gold price is around $5 lower, whilst the big mover is in oil which is around 5% higher.
The flash PMIs would help to drive sentiment today with the Eurozone data out at 0900GMT with a slight dip to 53.0 expected, whilst the US reading is at 1445GMT and is expected to improve to 51.5 (from 51.2). UK retail sales are at 0930GMT with the expectation of a slight dip back to a year on year ex-fuels 3.5%. The Canadian CPI is at 1330GMT and is expected to improve to 1.7%. US existing home sales are at 1500GMT and are expected to improve by 8.9% to 5.20m.
Chart of the Day – EUR/NZD
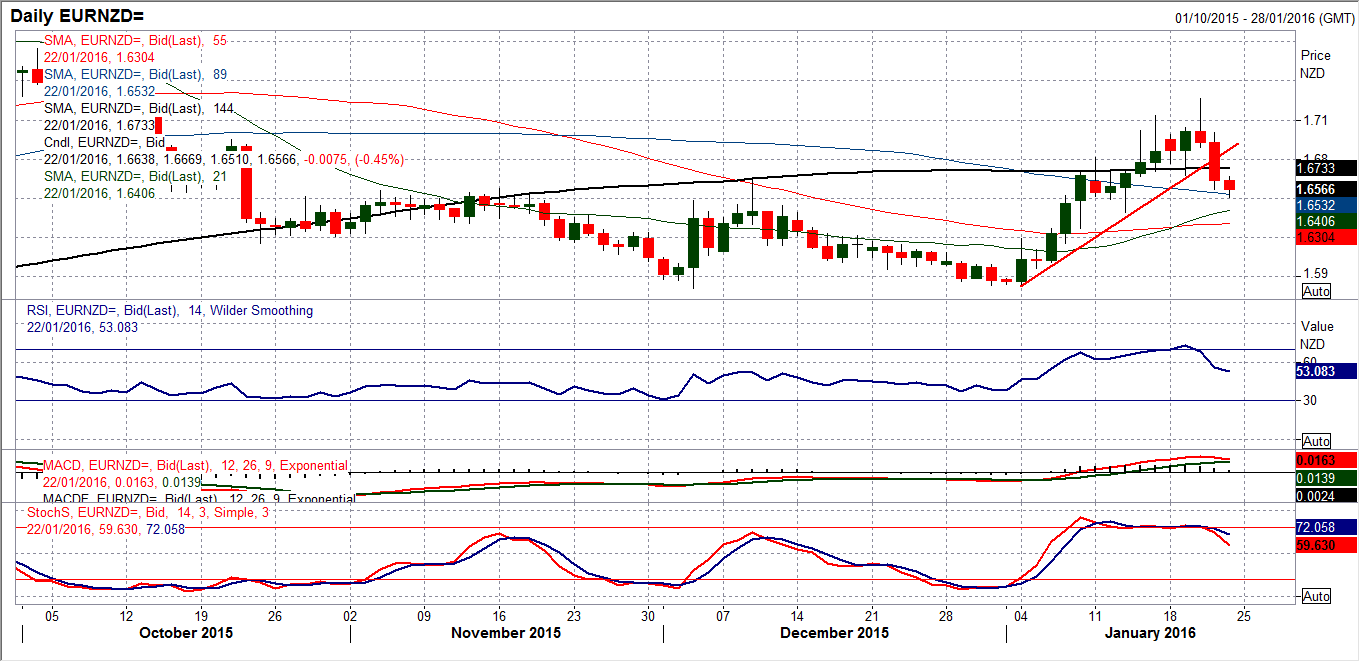
The market is now set up for a retracement of the January gains. A shooting star candlestick on Wednesday was followed by a sharp bearish candle yesterday. This has now broken the uptrend of the past two and a half weeks and a retracement is now on. Look now for confirmation on the momentum indicators confirming the breakdown. The RSI has already crossed back below 70 (basic sell signal), so we now need to Stochastics following with a deterioration. Watch for a breach of the support at 1.6670 which is the latest reaction low within the uptrend. The intraday hourly chart shows a strong near term pivot level around 1.6700, a breach of which arguably also completes a small top pattern that gives a downside target of 1.6265 at least. This is a development that goes against the risk aversion trade and would be a key signal for the market that the outlook is improving if it achieves its downside target. There is now initial resistance around the neckline 1.6700 towards 1.6780, whilst a move above the resistance at 1.7000 would abort the corrective near term outlook.
EUR/USD
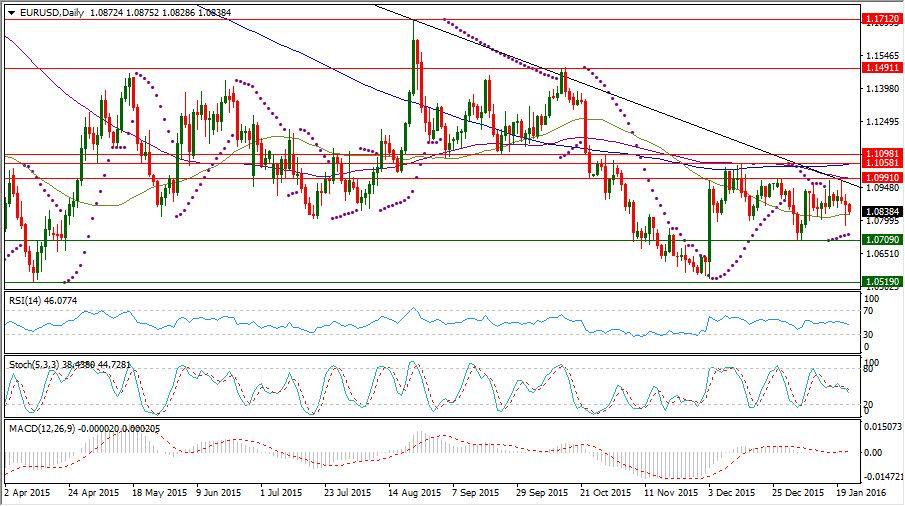
As a rule, if nothing else, Mario Draghi will talk the euro lower. And he did so, fairly successfully yesterday as the euro initially broken below the old floor at $1.0810. This was more of a shot across the bows as the intraday swing back completed a rather neutral candle in the end. However it may have begun a new feeling that the euro may now be on a negative drift as today we are seeing further weakness. I am not going to turn negative (near term) on the euro until a closing break of the $1.0810 low, something which the euro has been reluctant to do. The near term technicals have started to fall from their previously neutral configuration, and they will react fairly quickly when the market is so finely balanced. The hourly chart shows slightly negative momentum also developing and it looks as though there has been a slight shift in mind-set. Pressure on $1.0810 is likely to be seen with another breach today opening yesterday’s low at $1.0777 and the support at $1.0710. A pivot around $1.0900 is also forming.
GBP/USD
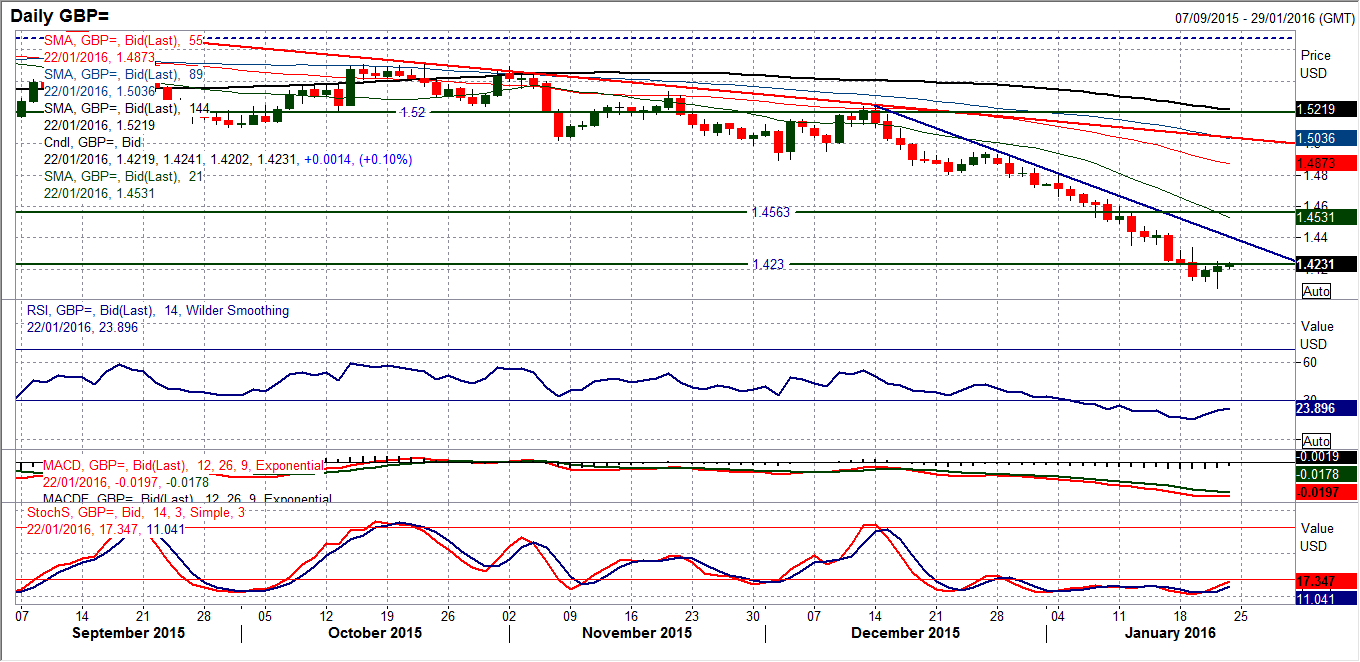
I think that Cable will be an interesting barometer for the turnaround for the market. Sterling has been shot to pieces in recent weeks and is deeply oversold, however there is now some interesting reversal signals. A bull hammer yesterday formed a low at $1.4217 and looks to be turning around sentiment, at least in the near term. With the RSI having previously hit 15 it is about time too. The intraday hourly chart shows that resistance in place. The old supports becoming new resistance has been an excellent technical feature of the chart but now they are under pressure. Initially, we have seen the $1.4235 resistance under pressure overnight and if this level were to be breached then it would be a key improvement in the near term outlook. The subsequent resistance is then $1.4350 and $1.4490. The downtrend of the past 6 weeks today comes in around $1.4400 and it is perfectly possible a rally could unwind Cable back to it in the coming days if the resistance can be breached. Initial support is now building around $1.4200.
USD/JPY
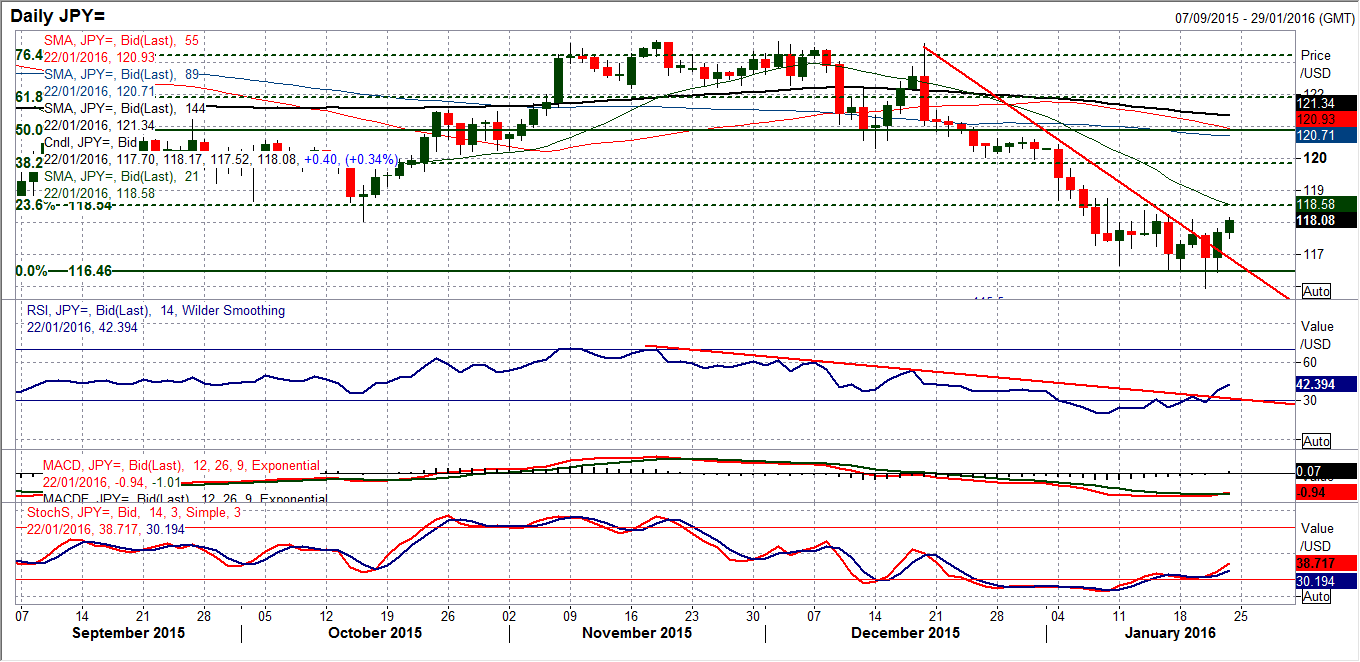
That initial intraday breach of 116.46 on Wednesday may prove to be the nadir, at least for the time being, as the bulls reacted well yesterday afternoon and have continued to support overnight. There have also been some interesting technical improvements. The downtrend (not a perfect one) of the past month has been broken, whilst the daily RSI also confirms the breaking of the bearish momentum. The Stochastics have turned up and are actually improving now, whilst the MACD lines are also crossing higher for a buy signal. The daily chart shows that there is some key resistance now overhead at 118.35 which needs to be broken. A confirmed move (on a closing basis) above here would actually complete a small base pattern and imply 175 pips projected higher which is around 120 again. This would mean a move above the 23.6% Fibonacci level (at 118.55). The intraday hourly chart shows the initial resistance at 118.10 is being tested now and a breach would be the first time that a key lower high had been breached for the first time since mid-December, and would represent a key technical improvement. The resistance at 118.75 is key near term. There is still a pivot at 117.20 which is the initial support.
Gold
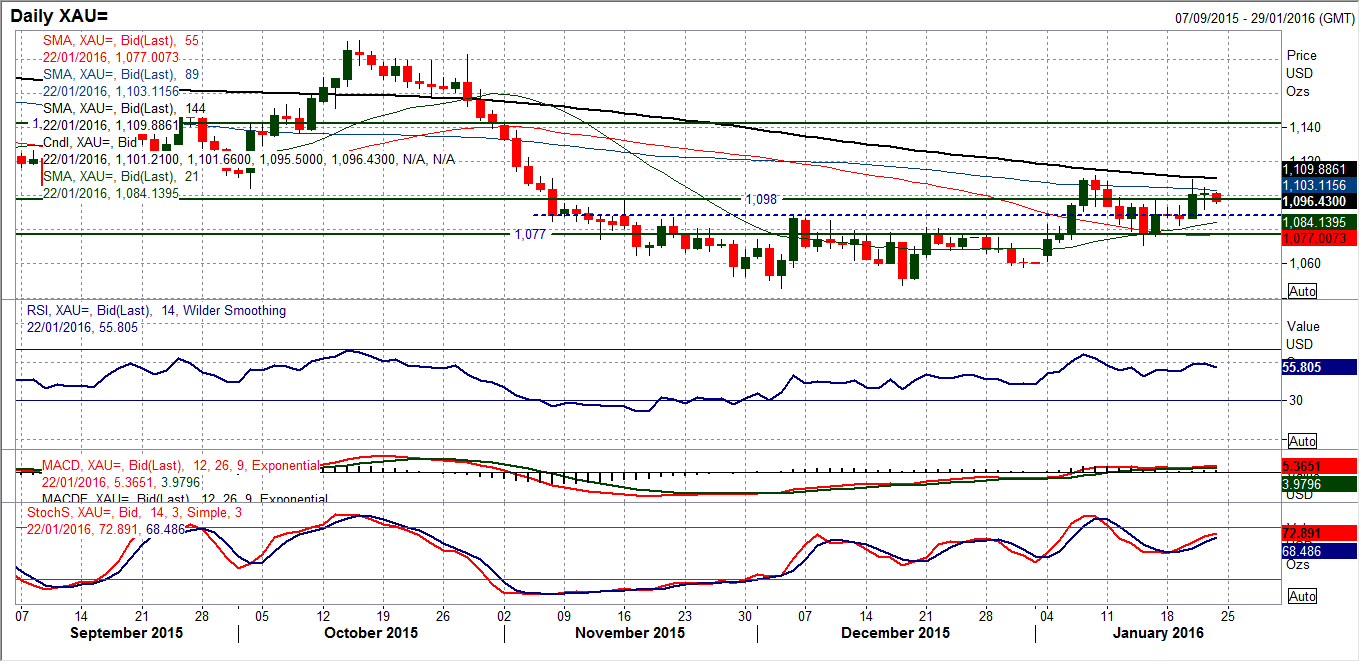
If market sentiment improves then it should follow that gold will struggle. The gold price yesterday formed a very neutral candle and despite the second close above $1098, I am sceptical that the outlook is indeed positive and I remain neutral. The gold chart has a marginally positive set of momentum indicators but is trading within a whole series of neutral moving averages and not only that, finding resistance with the underside of the falling 144 day moving average (currently $1110). Today’s reaction that the price is lower in a general market of improving sentiment is also in keeping with what can be expected. I was disappointed in the lack of buying on gold during the recent market turmoil and it could now be the turn of the bears to take advantage. The resistance comes in at $1109.20 from Wednesday’s high and then the January high at $1112.00. The hourly chart shows that the pivot around $1093 is still holding, but if this is breached decisively then I would expect a drift back to test $1082.50 and towards the key pivot at $1077.
WTI Oil
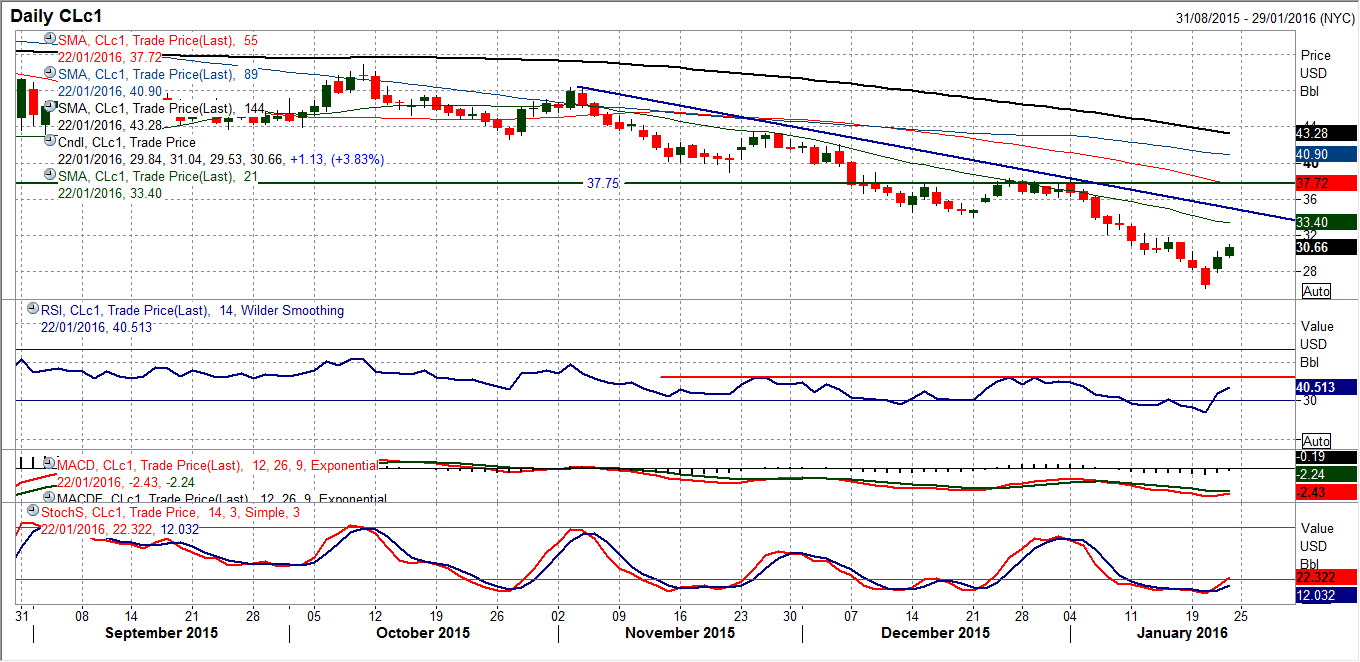
Can we start to believe that a recovery is underway? Oil moved counter to the moves that would have been expected from the significant increase in supplies contained in the EIA report which suggests the move could be an unwinding move rather than solid buying pressure. After such a dramatic downside move in the early weeks of 2016, this short covering bounce is easy to understand, but harder to trust. So far this looks to be simply unwinding oversold momentum with the RSI bouncing from 20 and back above 30. The daily chart shows that 50 tends to be the area where these unwinds get back to on the daily chart. I would in no way take this as a buy signal, more that short positions are being reconsidered now. The initial key near term test of the resistance band $30.00/$30.20 has been taken out early this morning which is a continuation of the short covering, however the real test will be the more considerable resistance is the range $31.75/$32.250. The near term support is now in place at $27.85.
Note: All information on this page is subject to change. The use of this website constitutes acceptance of our user agreement. Please read our privacy policy and legal disclaimer. Opinions expressed at FXstreet.com are those of the individual authors and do not necessarily represent the opinion of FXstreet.com or its management. Risk Disclosure: Trading foreign exchange on margin carries a high level of risk, and may not be suitable for all investors. The high degree of leverage can work against you as well as for you. Before deciding to invest in foreign exchange you should carefully consider your investment objectives, level of experience, and risk appetite. The possibility exists that you could sustain a loss of some or all of your initial investment and therefore you should not invest money that you cannot afford to lose. You should be aware of all the risks associated with foreign exchange trading, and seek advice from an independent financial advisor if you have any doubts.
Recommended Content
Editors’ Picks
EUR/USD edges lower toward 1.0700 post-US PCE

EUR/USD stays under modest bearish pressure but manages to hold above 1.0700 in the American session on Friday. The US Dollar (USD) gathers strength against its rivals after the stronger-than-forecast PCE inflation data, not allowing the pair to gain traction.
GBP/USD retreats to 1.2500 on renewed USD strength

GBP/USD lost its traction and turned negative on the day near 1.2500. Following the stronger-than-expected PCE inflation readings from the US, the USD stays resilient and makes it difficult for the pair to gather recovery momentum.
Gold struggles to hold above $2,350 following US inflation

Gold turned south and declined toward $2,340, erasing a large portion of its daily gains, as the USD benefited from PCE inflation data. The benchmark 10-year US yield, however, stays in negative territory and helps XAU/USD limit its losses.
Bitcoin Weekly Forecast: BTC’s next breakout could propel it to $80,000 Premium

Bitcoin’s recent price consolidation could be nearing its end as technical indicators and on-chain metrics suggest a potential upward breakout. However, this move would not be straightforward and could punish impatient investors.
Week ahead – Hawkish risk as Fed and NFP on tap, Eurozone data eyed too

Fed meets on Wednesday as US inflation stays elevated. Will Friday’s jobs report bring relief or more angst for the markets? Eurozone flash GDP and CPI numbers in focus for the Euro.
