Market Overview
Market sentiment has taken another boost off the news that the Greek parliament has passed through the proposals necessary for the bailout to go across to other Eurozone parliaments to vote on now. The series of tax hikes, spending cuts and pension reforms did not pass through cleanly whilst civil unrest returned to the streets of Athens once more. Attention now turns to the ECB and whether it will increase the Emergency Liquidity Assistance above the existing €89bn ceiling which has resulted in the closure of the Greek banks for the past couple of weeks. Mario Draghi’s press conference today could have an added element of spice to it if the ECB denies the increase leaving the banks shut as they continue to run out of money. Furthermore, there is the need for “bridging finance” of around €7bn so that Greece can meet its debt repayments in the coming days (notably €35bn to the ECB on Monday 20th July.
Equity markets in Europe have jumped early today on the news of the Greeks passing the bailout deal, coming after Asian markets were also positive overnight. Wall Street closed very slightly lower (S&P 500 down by just shy of 0.1%) as Janet Yellen once more re-iterated her expectation that it would be appropriate for the Federal Reserve to enact its first rate hike this year. Markets appeared to be comfortable with this assertion.
In forex markets the dollar strength is gradually coming through once more, helped by the Yellen comments, even if there is no decisive move in early trading today. The Kiwi is once more the major currency under the biggest pressure, with no fundamental newsflow attributed.
Today the market will turn attention to the ECB, with not only the decision over emergency financing of Greek banks, but also the ECM monetary policy and also Mario Draghi’s press conference. There is no expectation of any change in policy, but the press conference as ever will be something to keep an eye on with focus surely to be on Greece. Other than that, the final reading of Eurozone inflation is at 1000BST which is expected to be in line with the flash at +0.2%. Also weekly jobless claims are at 1330BST and are expected to show a slight improvement to 285,000 (from 297,000 last month).
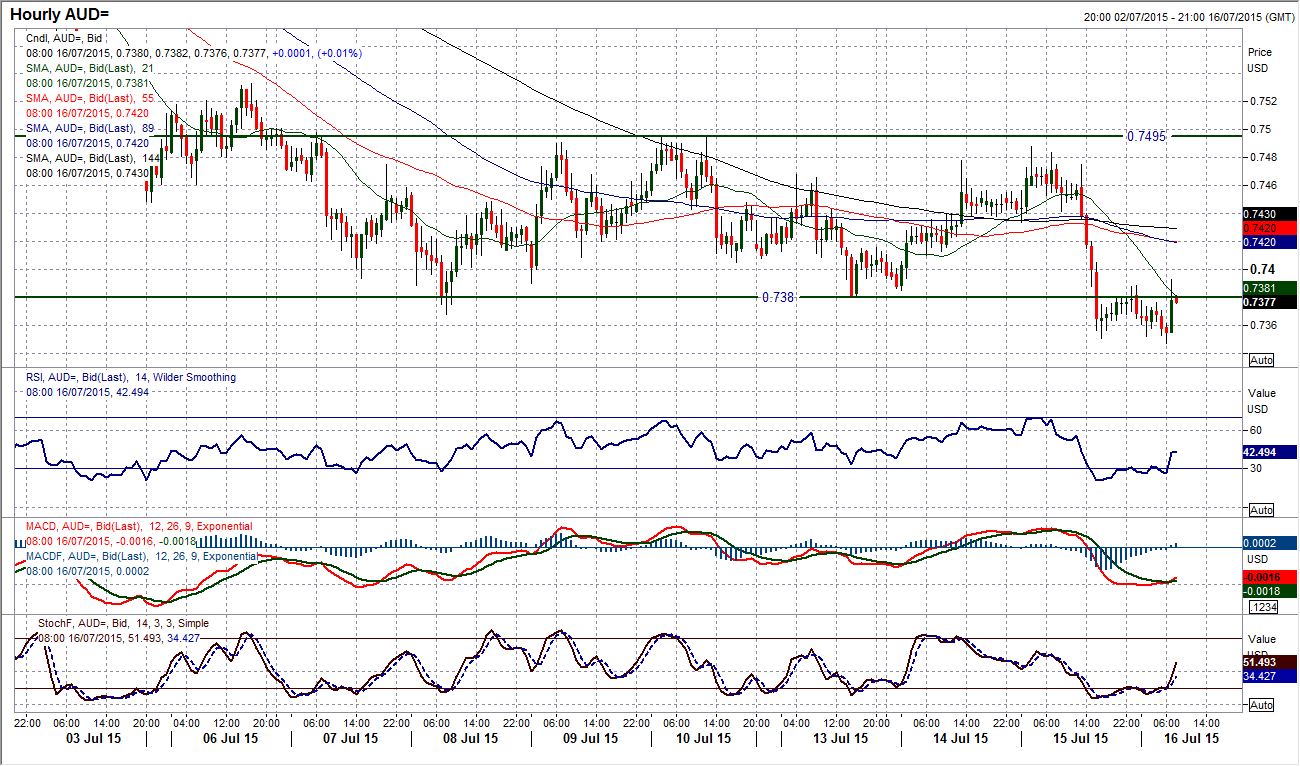
Chart of the Day – AUD/USD
Since breaking to new multi-year lows (lowest since early 2009) under the old key support at $0.7530 the Aussie has been consolidating in a range. This range has lasted for the past week and failing to get back above $0.7500. However now with a bearish engulfing candle yesterday (bearish outside day) there seems to be once more a renewed appetite for the bears. The momentum indicators on the daily chart are all negatively configured with the Stochastics once more bumping along the bottom and RSI ominously consistently hovering around 30. This suggests there could be another leg downward imminently. The intraday hourly chart shows the near term range above $0.7370 breaking down yesterday and seemingly accepted today. A closing breach would imply around 120 pips of downside target towards $0.7250. The hourly momentum indicators suggest using rallies as a chance to sell. There is near term resistance band between $0.7370/$0.7405.
EUR/USD
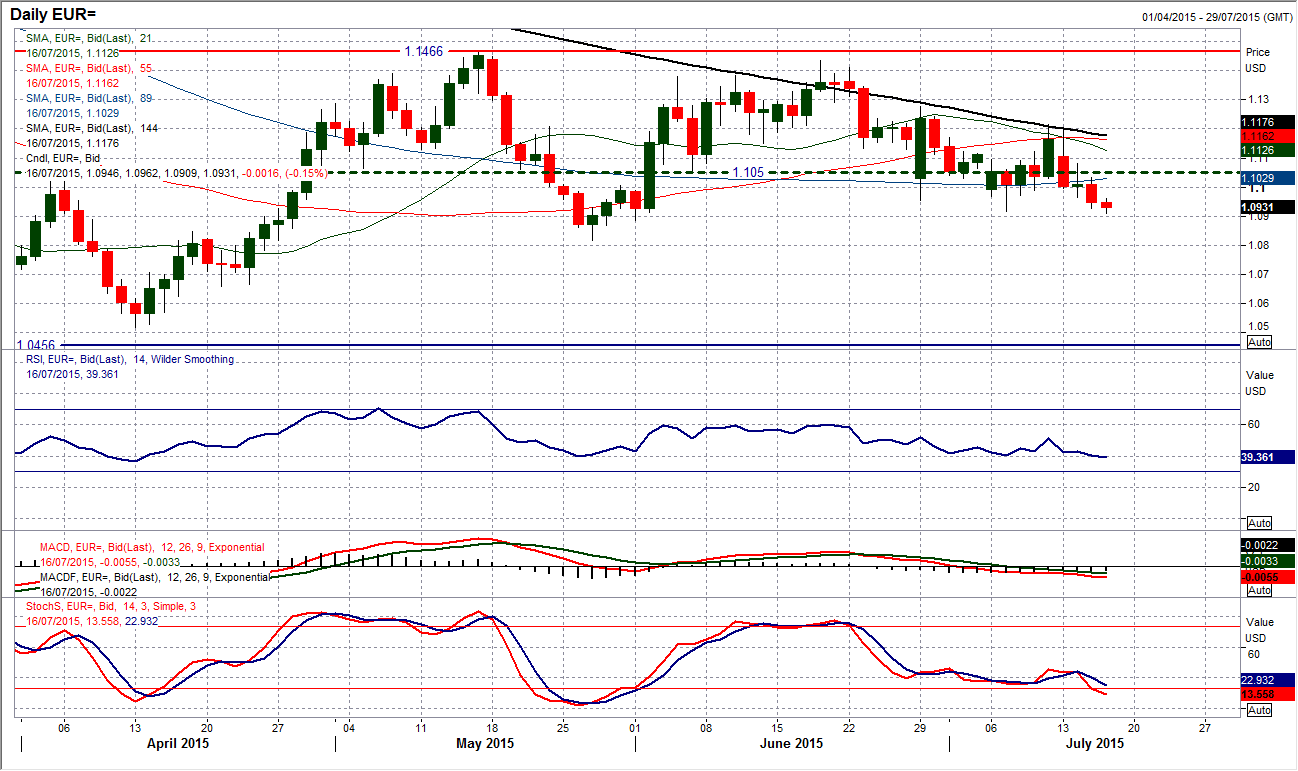
The bearish drift on the euro is gathering pace now. Throughout this week (ever since Monday’s deal for Greece), the downside pressure has been growing. The pressure on the July low at $1.0915 resulted in the briefest of breaks in the Asian session today, but there is little reason to suggest there will not be further downside pressure again today. With daily momentum deteriorating, I expect to see further weakness and a move back towards a test of the key May low at $1.0818 is increasingly likely now. The intraday hourly chart shows a series of lower highs adding resistance, with $1.1035 from yesterday as the main marker point, however I would not anticipate any intraday rally today likely to come up against the sellers in a 25 pip band of resistance between $1.0960/$1.0985 (a series of old support and new resistance from the past couple of days). The hourly moving averages and momentum indicators are all negative too, with any unwinding on the hourly RSI above 50 in the past two days being sold into.
GBP/USD
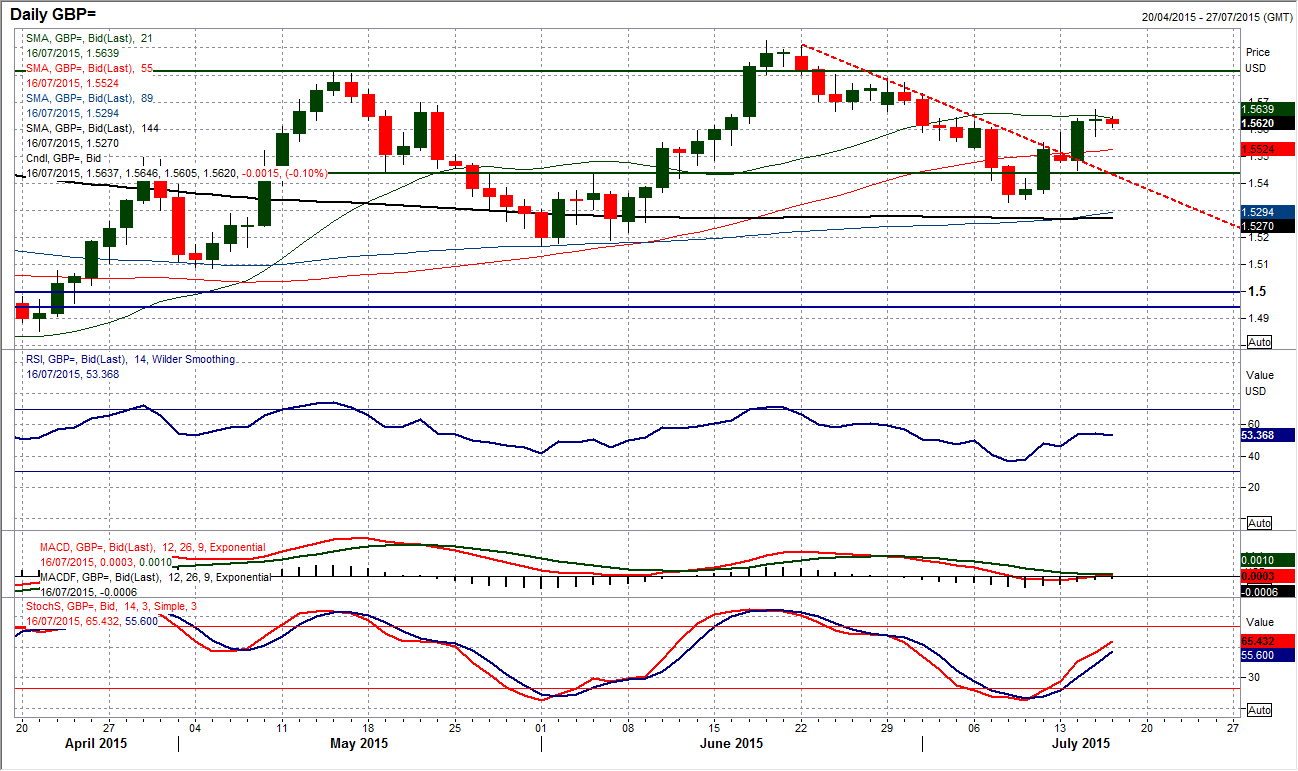
After such a strong reaction candle on Tuesday, the “doji” candle from yesterday’s trading has been a bit of a downer for the bulls. This denotes an uncertainty with the recent rally, and if the early Asian trading session today is any signal, this will only add to the disappointment as it has shown Cable starting to fall away. I am subsequently stuck on the fence a touch as I understand that recent trends on Cable have managed to go for around two to three weeks before a meaningful reversal. The momentum indicators have turned more positive again with the Stochastics rising and the MACD lines bottoming. Looking at the hourly chart the Fibonacci retracement levels of $1.5188/$1.5928 are in play once more as turning points. That would suggest that there could now be a drift back towards the 50% level at $1.5558 again, with yesterday’s reaction low at $1.5575. I would be mindful only to play a Cable short for only a very short term as the bigger trend still remains higher and this should eventually be a drag higher on sterling.
USD/JPY
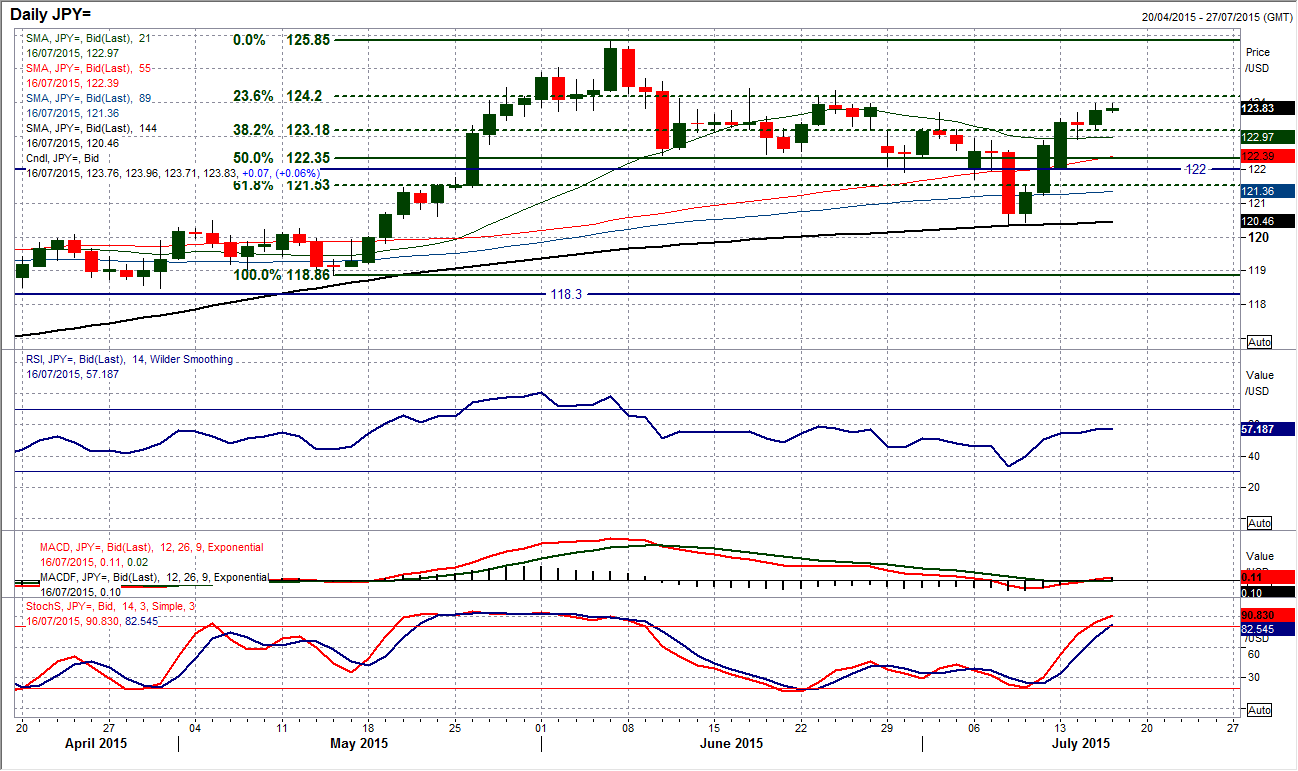
The rally on Dollar/Yen continues higher but is now increasingly encountering key overhead resistance levels which will make the next few days trading pivotal near term. A move yesterday above 123.72 has now opened the 23.6% Fibonacci retracement level at 124.20 which is a level that acted as a basis of resistance in mid to late June as the peak at 124.43 was formed. I also notice that the RSI is once more up towards 60 which is a level around which the RSI also peaked in late June. That would suggest that if the bulls can maintain this run and push the RSI above 60 consistently then the momentum would be building for further gains an possibly even a retest of the high subsequently at 125.85. Looking at the hourly chart though leaves me a little less confident of the strength of the bull run. The hourly Stochastics have started to fall away and there is still hints at negative divergences on RSI and MACD lines. That will all make it even more important for the test of the overhead resistance. Initial support is the 38.2% Fibonacci retracement at 123.20.
Gold
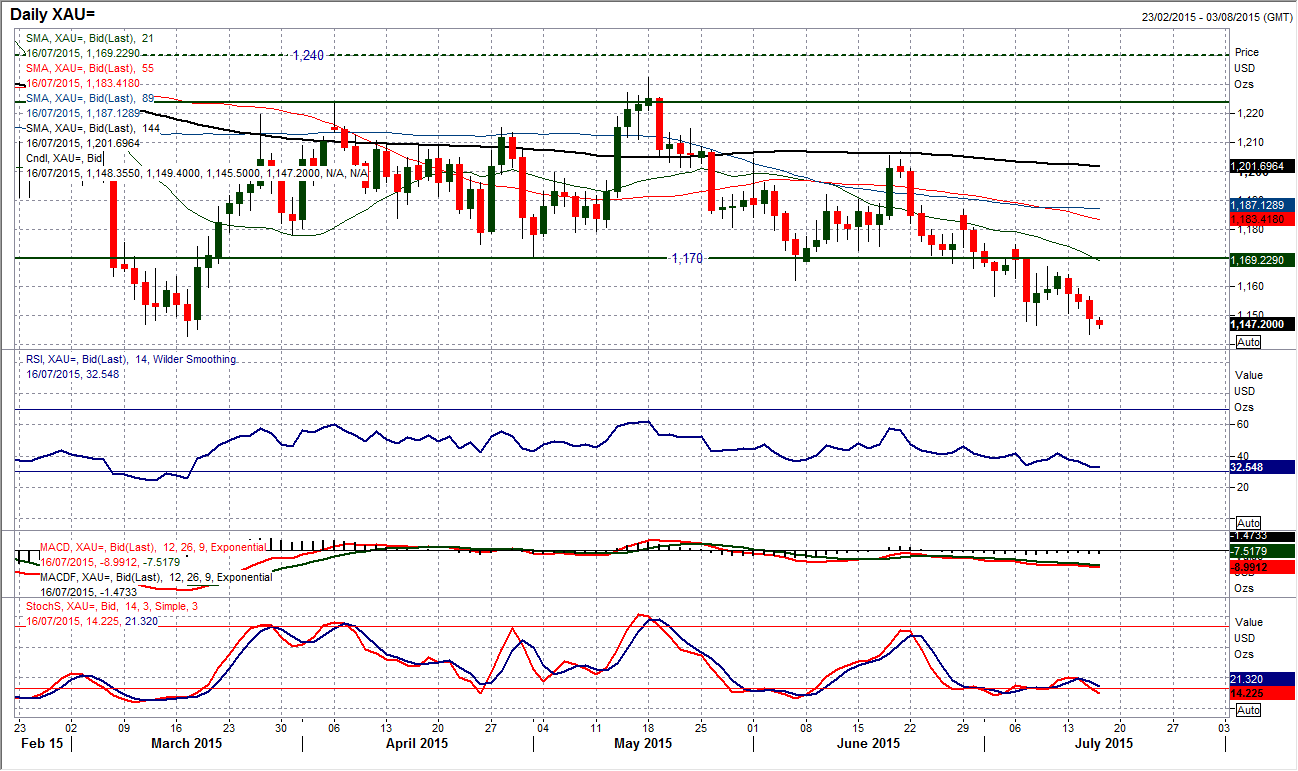
With another bearish candle the gold price has come within touching distance of the key March low at $1142.85 (less than $1 away at yesterday’s low). Once more I have to re-iterate that I remain bearish on gold near to medium term, though I still look at the candles and see a lack of real selling conviction from the bears. Yesterday’s candle once more had the potential to be strongly bearish ($14 daily high to low range) but the closing price was around the mid-point of the range, suggesting a loss of conviction by the bears on the day. Perhaps I am being a bit picky, but it does go to show that there are also intraday rallies that give near term selling opportunities. There is a sequence of lower highs and lower lows in the past 4 weeks too, whilst momentum indicators are in bearish configuration. A successful breach of the support at $1142.85 would re-open the critical November low at $1131.85. The intraday hourly chart shows resistance now in the band $1152.50/$1159.50.
WTI Oil
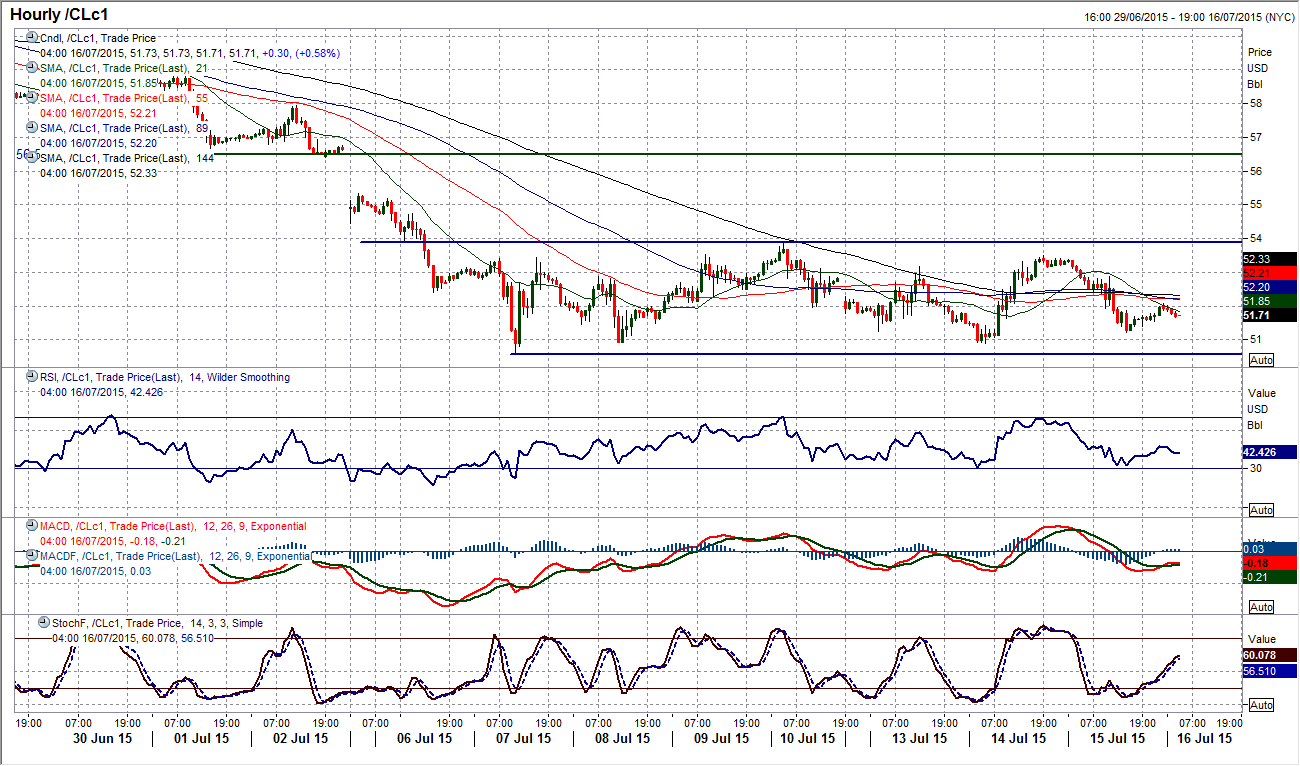
Despite the announcement of the Iranian sanctions deal, we are still yet to have a breakout from the near term range. This range is around 6% wide between the key low at $50.58 and the rally high at $53.89. Near term daily technical indicators are increasingly neutral, however the overriding medium term breakdown below the old support at $56.50 implies further weakness towards $49.50 in due course, all of which suggests selling into rallies. I am increasingly mindful of using the hourly RSI as a near term gauge and when it is unwinding higher to use as a chance to sell. I expect pressure on the lows of this range and favour an eventual downside break. A closing break above $53.89 would improve the near term outlook, but this would still be seen as part of an extended rally before the bears return once more.
Note: All information on this page is subject to change. The use of this website constitutes acceptance of our user agreement. Please read our privacy policy and legal disclaimer. Opinions expressed at FXstreet.com are those of the individual authors and do not necessarily represent the opinion of FXstreet.com or its management. Risk Disclosure: Trading foreign exchange on margin carries a high level of risk, and may not be suitable for all investors. The high degree of leverage can work against you as well as for you. Before deciding to invest in foreign exchange you should carefully consider your investment objectives, level of experience, and risk appetite. The possibility exists that you could sustain a loss of some or all of your initial investment and therefore you should not invest money that you cannot afford to lose. You should be aware of all the risks associated with foreign exchange trading, and seek advice from an independent financial advisor if you have any doubts.
Recommended Content
Editors’ Picks
EUR/USD holds below 1.0750 ahead of key US data

EUR/USD trades in a tight range below 1.0750 in the European session on Friday. The US Dollar struggles to gather strength ahead of key PCE Price Index data, the Fed's preferred gauge of inflation, and helps the pair hold its ground.
GBP/USD consolidates above 1.2500, eyes on US PCE data

GBP/USD fluctuates at around 1.2500 in the European session on Friday following the three-day rebound. The PCE inflation data for March will be watched closely by market participants later in the day.
Gold clings to modest daily gains at around $2,350

Gold stays in positive territory at around $2,350 after closing in positive territory on Thursday. The benchmark 10-year US Treasury bond yield edges lower ahead of US PCE Price Index data, allowing XAU/USD to stretch higher.
Bitcoin Weekly Forecast: BTC’s next breakout could propel it to $80,000 Premium

Bitcoin’s recent price consolidation could be nearing its end as technical indicators and on-chain metrics suggest a potential upward breakout. However, this move would not be straightforward and could punish impatient investors.
US core PCE inflation set to signal firm price pressures as markets delay Federal Reserve rate cut bets

The core PCE Price Index, which excludes volatile food and energy prices, is seen as the more influential measure of inflation in terms of Fed positioning. The index is forecast to rise 0.3% on a monthly basis in March, matching February’s increase.
