Market Overview
There were some interesting moves on forex markets yesterday which suggest there could be something sustainable building in this move away from the dollar. There are some key markets on the brink of making key breakthroughs which could trigger wider dollar selling. I am subsequently watching out for signals on the euro and Kiwi, as well as WTI oil and also the gold price. If these continue to improve then it could be vitally important for the medium term prospects of the dollar.
Today’s reaction to the disappointing data out of Asia will be interesting. The flash manufacturing PMI data for both Japan and China both came in worse than expected. Japan fell to 50.4 from 51.5 last month, whilst China was a real concern as it fell to a nine month low and well into contraction territory once more at 49.2 (50.6 had been expected and this was down from the 50.1 last month). The normal course of events is that this would lead to speculation over additional stimulus from the People’s Bank of China, however reaction in Asian trading has not been great, with markets all lower, with the Nikkei 0.2% lower. This is in a way a continuation of the slightly corrective pressure seen on Wall Street last night with a 0.2% decline. European markets are also slightly lower in similar fashion in early trading today.
In light of what has gone on in recent days, forex trading is fairly settled today. There is a very slight bullish dollar bias this morning, with euro and sterling both correcting. However nothing too significant. There is a batch of important data to watch for today which could drive trading. The UK CPI inflation data is released at 0930GMT and is expected to show disinflation continues to drag CPI back to just +0.1% (down from +0.3). Anything lower than this would put pressure back on sterling once more. Then the key data release of the day at 1230GMT with US CPI. Both the headline and the core data are forecast to stay flat on last month’s readings with -0.1% for the headline and +1.6% for the core data. Hitting the forecasts could provide the dollar with the supportive demand to stop the corrective move. There is also New Home Sales data at 1400GMT which is expected to dip very slightly to 470k (from 480k).
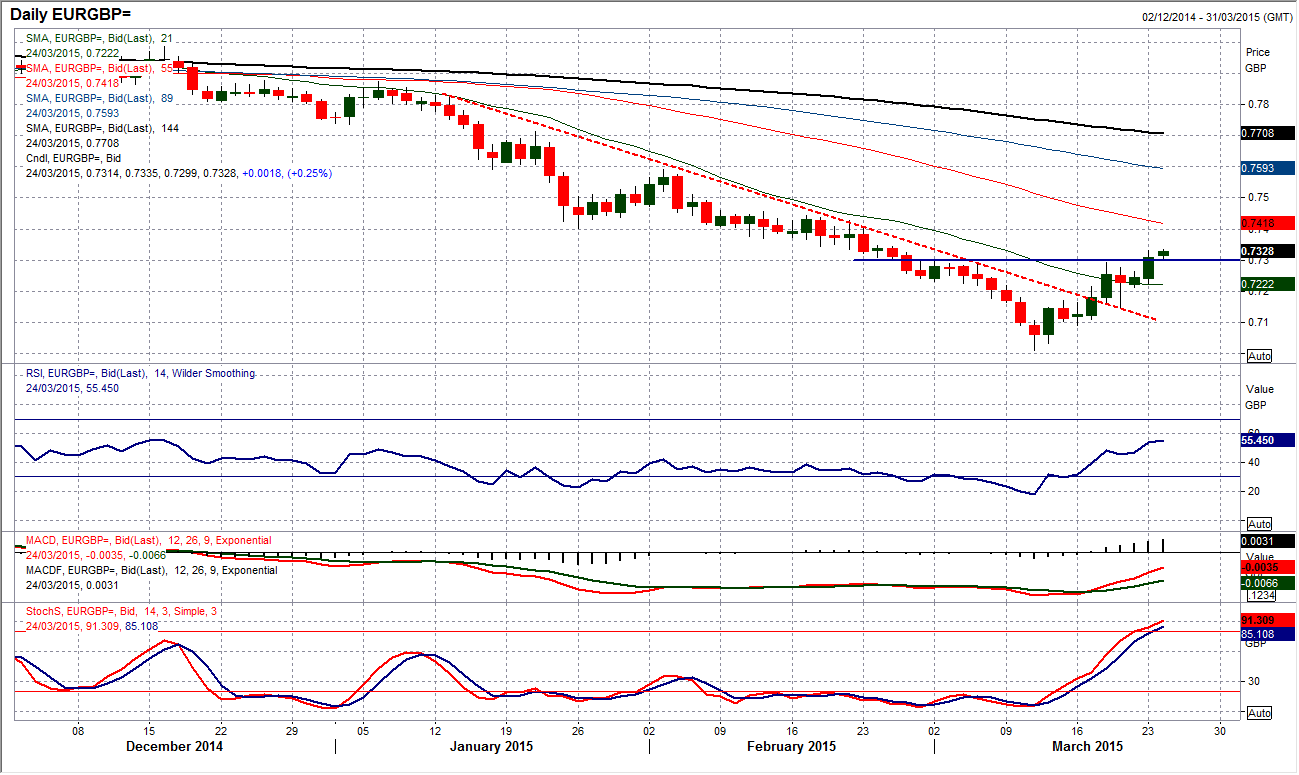
Chart of the Day – EUR/GBP
Euro/Sterling has seen an impressive recovery in the past week or so and it is now beginning to suggest that this move may be something more than just a kneejerk reaction. A two month downtrend has been broken and the resistance of the falling 21 day moving average has also been cleared. What we have also seen is a move above the resistance at £0.7300 which had held back the original bounce last week. There have been a series of bullish candles mixed with consolidation candles in the past 2 weeks and if the euro can now hold on to this move above £0.7300 then there really will be something to build upon. There has been a significant improvement in the momentum indicators with this move, with the RSI at its highest in 2015, whilst the Stochastics are at their strongest since November. This would all suggest the euro is outperforming sterling quite strongly through this dollar correction. The hourly chart shows a 40 pip band of support now £0.7225/£0.7265, whilst the rising 89 hour moving average (currently £0.7250) has supported each of the past 4 consolidations within the rebound.
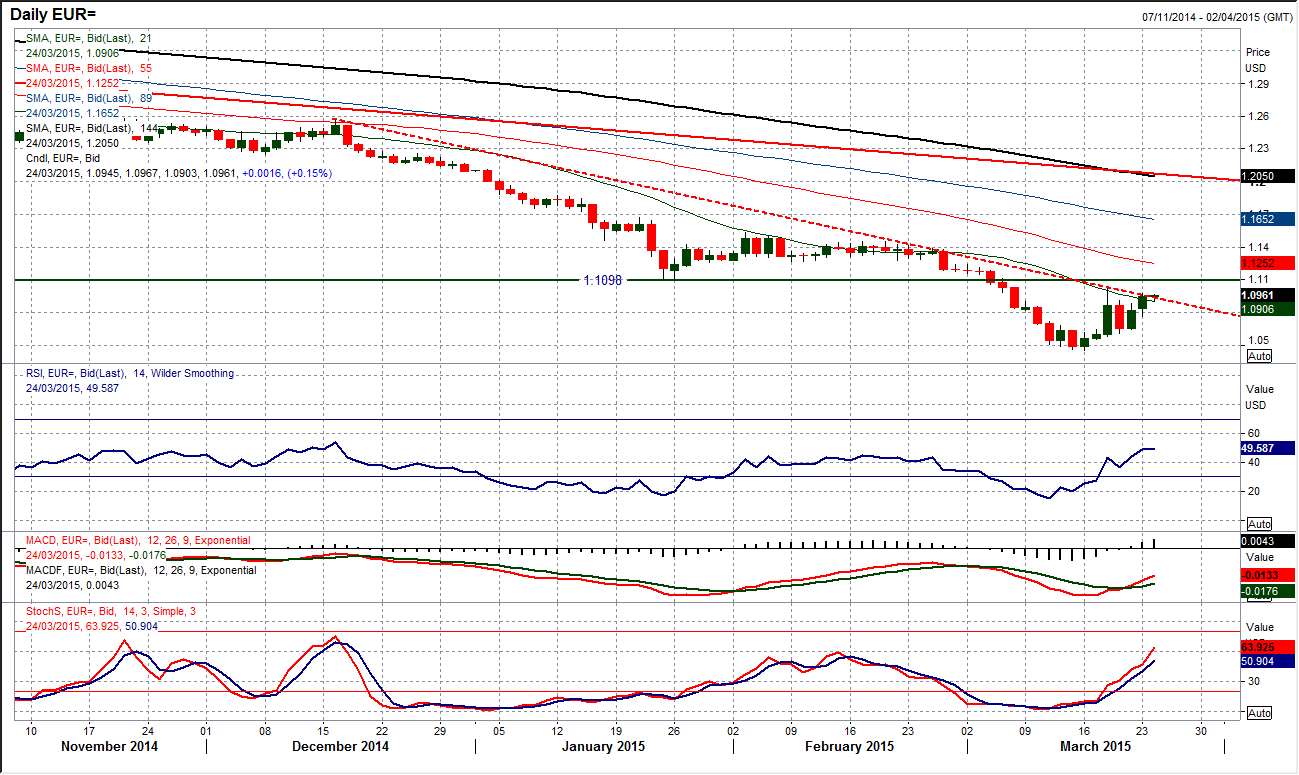
EUR/USD
We could be at something of a crossroads now on the euro. The rebound has been impressive, but s yet no major hurdle has been overcome that suggests that this is anything more than a bear market rally. That crossroads is that the euro is now at the resistance of a 3 month downtrend and the falling 21 day moving average (c. $1.0905) which has been the basis of resistance for several months. The daily RSI is at 49 and this has not been above 53 during the last 8 months of dollar strength. The big test could become the overhead old support which is new resistance at $1.1098. The intraday hourly chart remains encouraging for the bulls with a move now above $1.0900 which has been a level of resistance but in the past few hours has become supportive. There is minor resistance at $1.0970 before the spike high from last Wednesday at $1.1030. There is a sense that the euro recovery is continuing but it needs to complete some important technical breaks to suggest there could be some substance to it. We should begin to know soon.
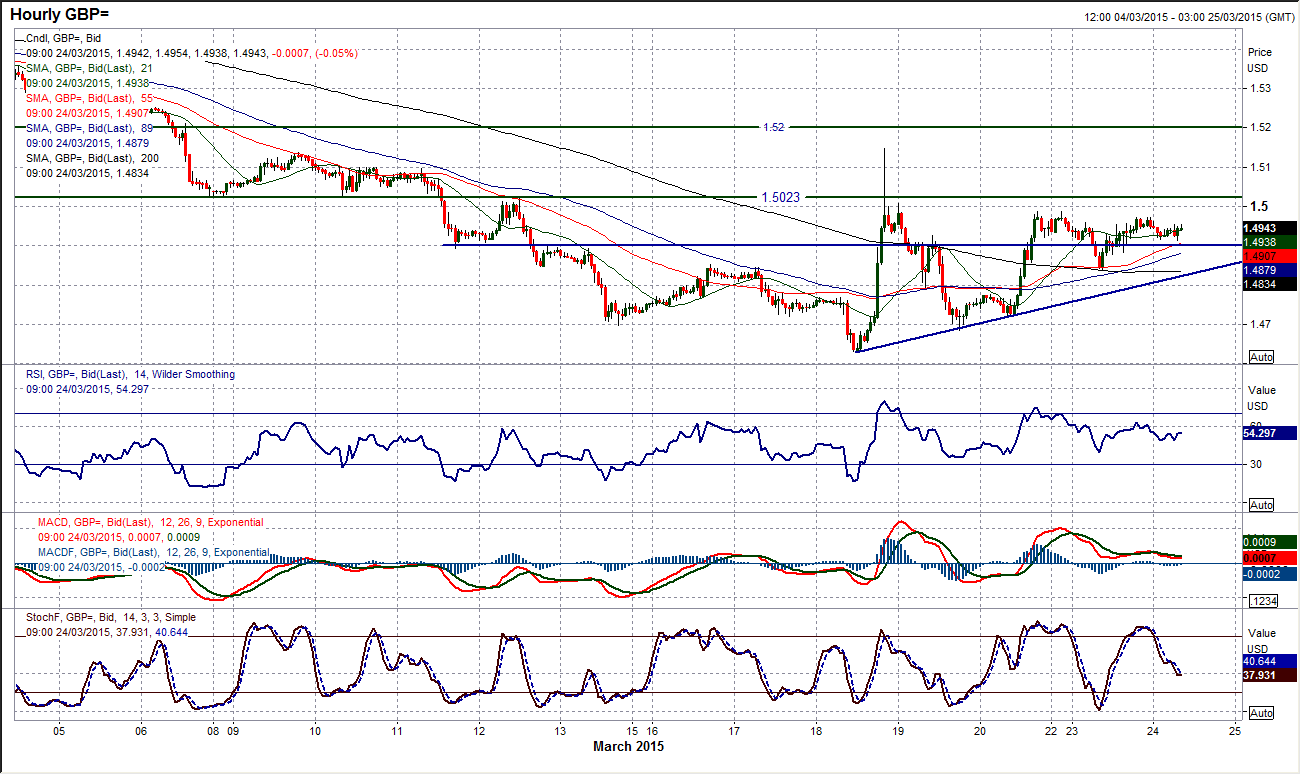
GBP/USD
It is debatable as to exactly what was achieved by Cable yesterday. The fact that the initial sell-off of over 100 pips was largely retraced was a positive, but question marks still hang over the chart with a failure once more to breach the resistance around $1.5000. The chart is subsequently showing more of a consolidation which is allowing the momentum indicators unwind from oversold. The outlook remains weak with little real progress, with trading continuing below the falling moving averages. I have my concerns over the longevity of this supposed rally. The intraday hourly chart is slightly more encouraging with a sequence of higher lows in place over the past few days but there needs to be a sustained push above $1.500/$1.5025 resistance to continue the recovery. If seen it would re-open the resistance at $1.5200. The rally is in danger of running out of steam, but today could also be crucial as there is inflation data for both the UK and US. Initial support of yesterday’s low at $1.4837 becomes important now.
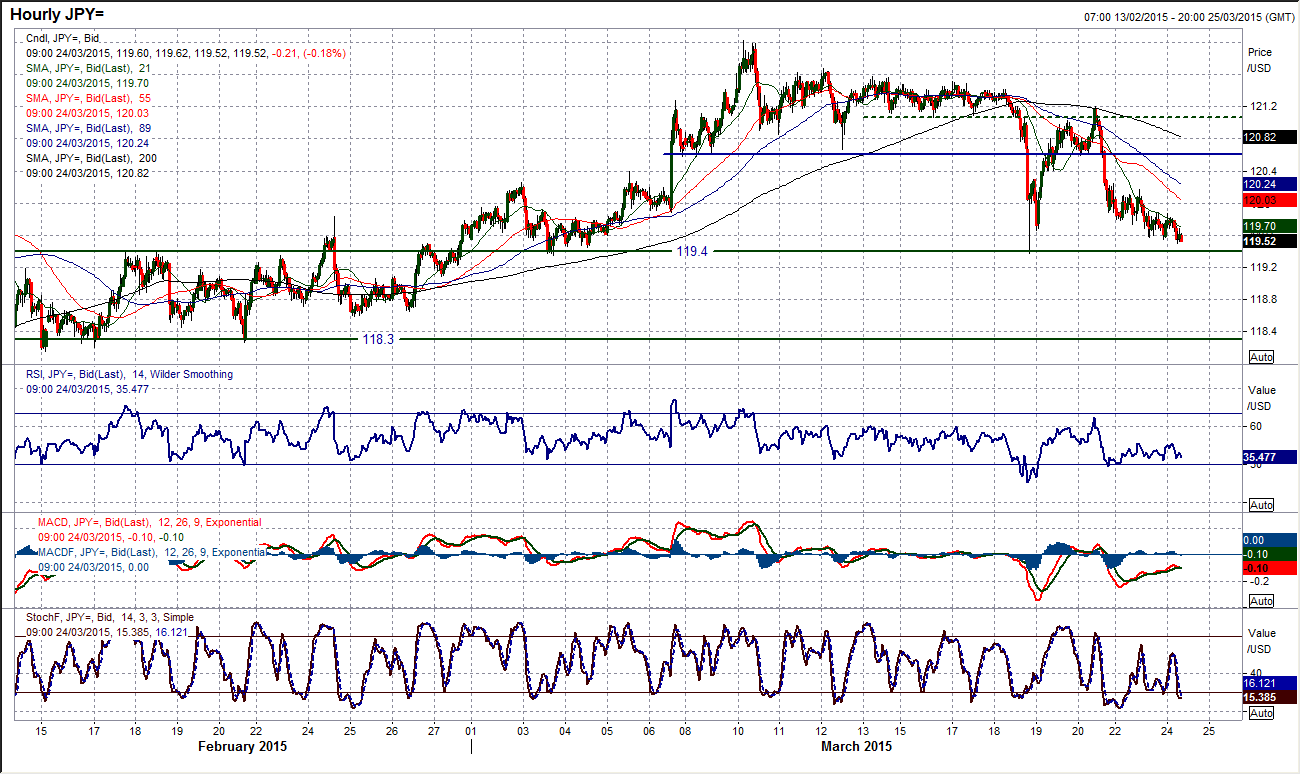
USD/JPY
I have been talking about some of the key charts that the US dollar is suffering in which are on the brink of significant moves that would continue a dollar correction. Dollar/Yen seems to be another one of these as the key support at 119.40 comes under continued pressure. Not only that but also the 2 month uptrend is being tested too. The momentum indicators are interesting as the RSI is now testing the levels it got back to in February, whilst the Stochastics are already at a 2 month low. The pressure is mounting and if the support of 119.40 is broken then there could quickly be a retreat towards 118.30 which is around the late February lows and really begin to suggest that the dollar bulls had relinquished any sort of near/medium term control. Hourly momentum indicators continue to deteriorate and it would need a move above 120.60 for the bulls to claw back a sense of ascendency.
Gold
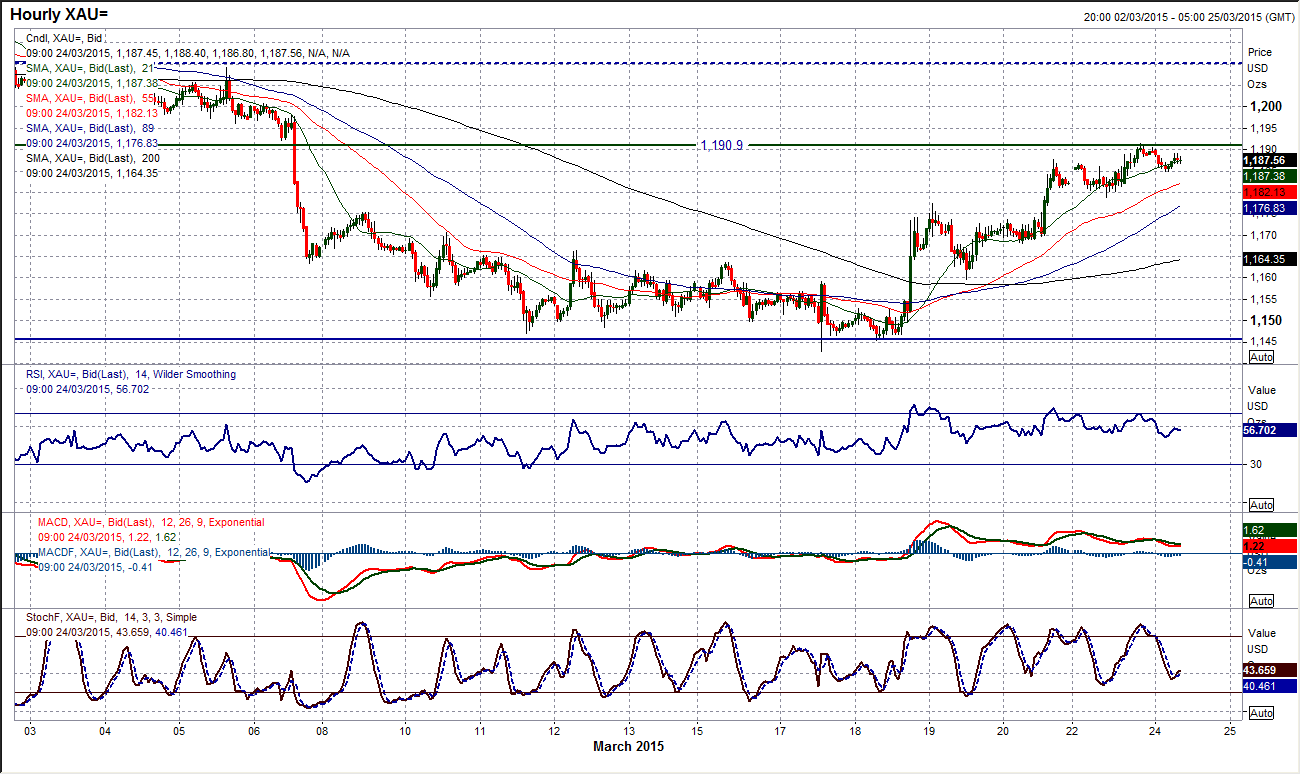
Gold is another instrument that has reached a crossroads and if the rally continues from here I may need to turn more bullish once more. With 4 straight days of gains we have seen the outlook for gold improve dramatically. The recovery has been seen across the momentum indicators with RSI and Stochastics both picking up strongly and even the MACD, which can be slower to react, improving. Having broken the downtrend channel and the barrier of the falling 21 day moving average, the next important test is already underway as the key overhead resistance at $1191 is tested. With the RSI at 50, an improving outlook would suggest the RSI would be consistently pushing towards 60 and above, whilst the Stochastics continue to advance towards positive territory. If gold can now make a consistent break above the old key support at $1191 and hold the break then there will be a considerable improvement in the outlook that we will need to appreciate. The intraday hourly chart reflects this improvement with a series of higher lows (the latest at $11778.85) supportive hourly moving averages and positive configuration across the hourly momentum indicators. I am close to turning bullish once more.
WTI Oil
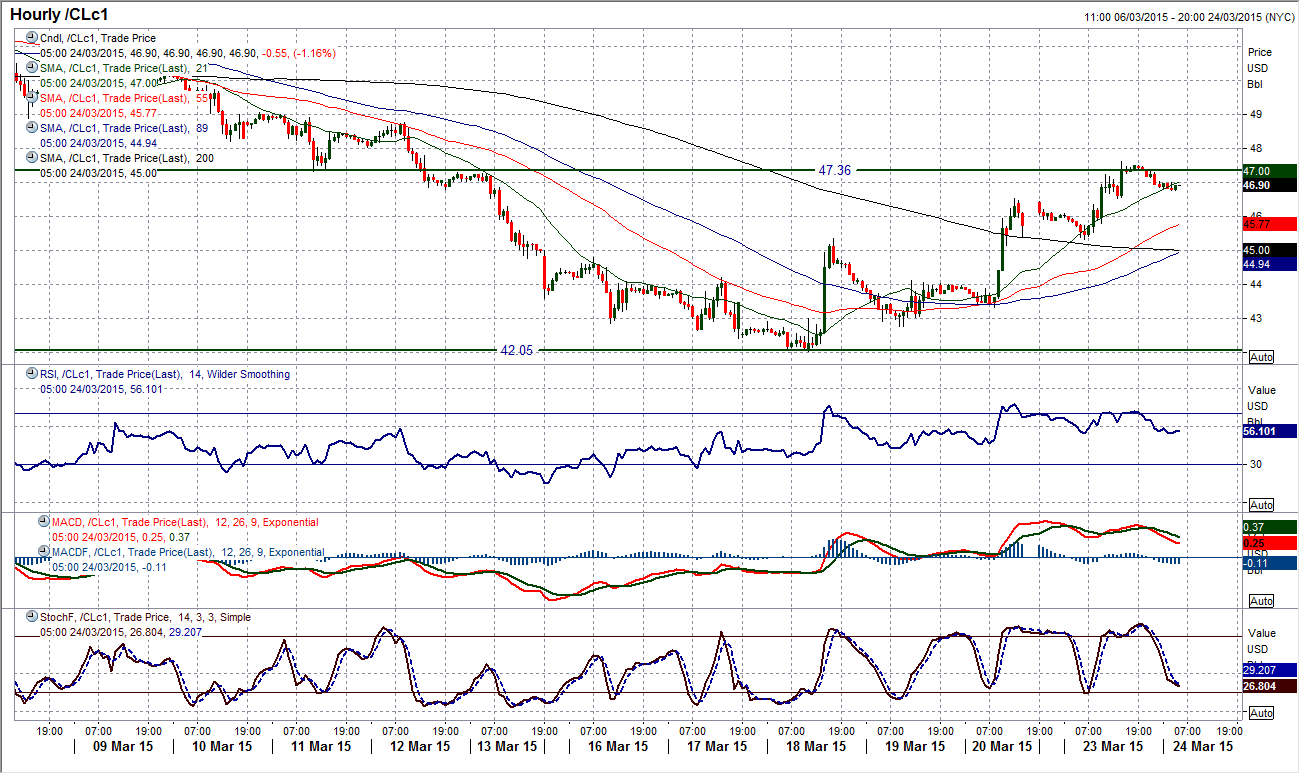
The solid rally on WTI continued yesterday (as the US dollar remained under pressure). The rebound is now up to its first test of serious resistance, the old floor of the key range that had been in place throughout February/early March. The resistance area begins around $47.36 up towards the old key lows in the trading range around $48.00. So far the band of resistance is holding, however, this means that it will be very interesting to see the reaction in the coming days at this resistance. If this dollar rally continues then WTI is likely to continue through the resistance band. Watch out for the 21 day moving average on the daily chart which could also now be a basis of resistance, falling at around $47.80. With the RSI up towards neutral again this would be a classic selling area if the dollar bulls can regain control again. This will be an interesting couple of days coming up. US CPI data this afternoon is likely to cause some significant volatility too.
Note: All information on this page is subject to change. The use of this website constitutes acceptance of our user agreement. Please read our privacy policy and legal disclaimer. Opinions expressed at FXstreet.com are those of the individual authors and do not necessarily represent the opinion of FXstreet.com or its management. Risk Disclosure: Trading foreign exchange on margin carries a high level of risk, and may not be suitable for all investors. The high degree of leverage can work against you as well as for you. Before deciding to invest in foreign exchange you should carefully consider your investment objectives, level of experience, and risk appetite. The possibility exists that you could sustain a loss of some or all of your initial investment and therefore you should not invest money that you cannot afford to lose. You should be aware of all the risks associated with foreign exchange trading, and seek advice from an independent financial advisor if you have any doubts.
Recommended Content
Editors’ Picks
EUR/USD edges lower toward 1.0700 post-US PCE

EUR/USD stays under modest bearish pressure but manages to hold above 1.0700 in the American session on Friday. The US Dollar (USD) gathers strength against its rivals after the stronger-than-forecast PCE inflation data, not allowing the pair to gain traction.
GBP/USD retreats to 1.2500 on renewed USD strength

GBP/USD lost its traction and turned negative on the day near 1.2500. Following the stronger-than-expected PCE inflation readings from the US, the USD stays resilient and makes it difficult for the pair to gather recovery momentum.
Gold struggles to hold above $2,350 following US inflation

Gold turned south and declined toward $2,340, erasing a large portion of its daily gains, as the USD benefited from PCE inflation data. The benchmark 10-year US yield, however, stays in negative territory and helps XAU/USD limit its losses.
Bitcoin Weekly Forecast: BTC’s next breakout could propel it to $80,000 Premium

Bitcoin’s recent price consolidation could be nearing its end as technical indicators and on-chain metrics suggest a potential upward breakout. However, this move would not be straightforward and could punish impatient investors.
Week ahead – Hawkish risk as Fed and NFP on tap, Eurozone data eyed too

Fed meets on Wednesday as US inflation stays elevated. Will Friday’s jobs report bring relief or more angst for the markets? Eurozone flash GDP and CPI numbers in focus for the Euro.
