Sun in Cancer- Major turn in trend

The sky is “busy”. There are some “ once in a lifetime” aspects, that boil up the status quo. To add to that, the Sun ingress to water Cancer, the new Moon on the 23rd of June, Venus on the “Weeping Sisters”, and we get a major fall in the markets. In the fundamental world “Brexit” is blamed.
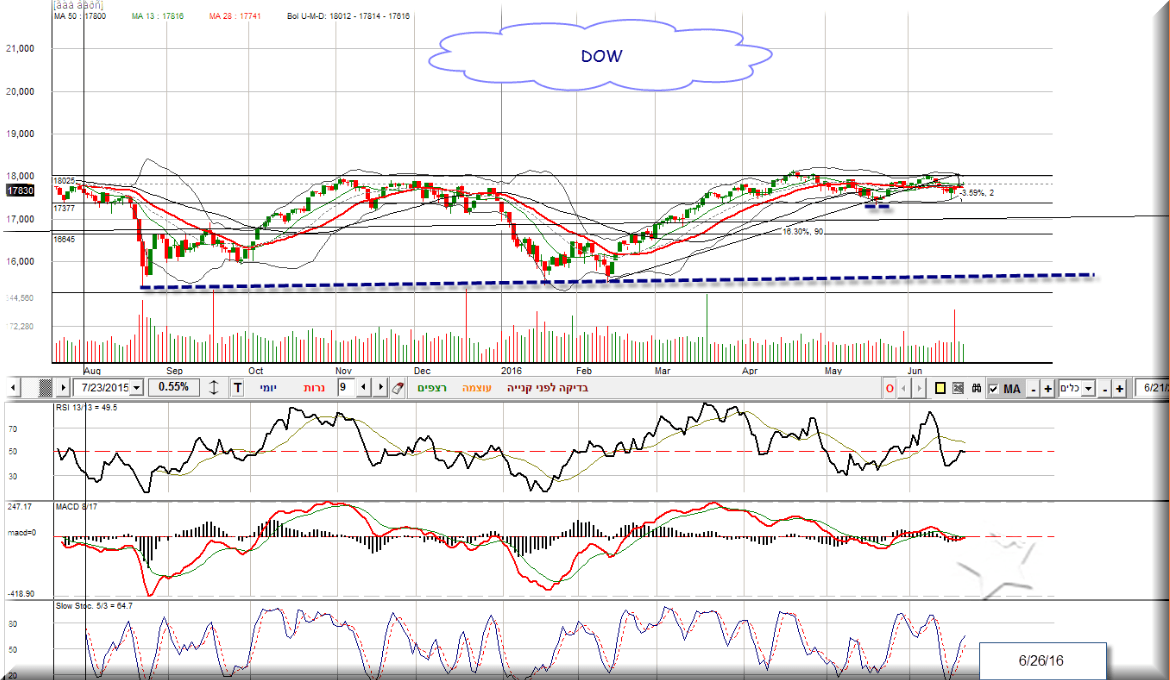
In my former letter, I pointed out, that as long as the Dow is above 17000, it is supported and we are long. Of course, this price level is for people who can afford a loss of 15-20%... I don’t know many.
To give you an example…. The DOW: rallied by 16.30% since Feb.11th, last day fell by 3.6% . What is the panic about?? To earn more than 16 percent was OK? For long term traders, it will be a short if the DOW falls below Feb.11th low: 15500. Till then it is just correcting the rally…
Since only a few people trade long term targets, I built my own application, where I give market alerts daily.. Here is the list of the last days:
June 22
Sky: rare events in the sky today...Mercury is 90 to the Nodes, Jupiter 120 to Pluto, the Moon is void, and will pass into Aquarius.. but, only after markets are closed. It’s effect will be felt tomorrow.
Sign up now for the long term forecast! $250 for 3 months..
Nifty: stop was 8250- we went short- lower it to 8225.
Aord: targets reached, now raise stop to 5346. Short below.
AXJO: raise stop to 5266- short below.
BAC: short below 13.60
TA25: topped at 1438.30 ( target was 1437)- Raise stop to 1427.
KS11: target was 1991- now raise stop to this level.
Dax: Stop was 9890- we went long above it. Target given in the weekly report 10200 is closer than ever.
^SET.BK: raise stop to 1429- short below.
Vix: Lower stop to 19.20- Long above.
S&P future: stop was 2081- we were stopped out when it fell to 2070. We are short below 2083, double short below 2075- target: 2067-2063-and lower.
Dow future targets given on 6/20, reached. We are short below 17800- will double short below 17700.
Gold: trade range is between 1260- 1270- breaking one end, we shall follow.
Crude: raise stop to 49.8. target former top 51.70. failing to reach it, we will prepare for short. CIT 6/25
S&P: 2081- long above it, to 2083-2085-2087- a dense resistance net- as you can see.
S&P: next levels: 2097- 2101-2105.50-2110
June 23
Sky: the Moon moved to Aquarius. here it brings a top or low for the S&P.
Nifty: stop was 8225- we went long above it. Targets up: 8253-8265-8271-8333-8340. As it goes up, raise the stop-so now to 8265
KLSE: stop was 1633- raise it to 1638. next up: 1643.
DAx: what a rally!!! raise stop to 10200-target reached! Should go above 10370- for a rally- till now this was just a correction.
June 24
Last alert on the Nifty was:
Nifty: stop was 8225- we went long above it. Targets up: 8253-8265-8271-8333-8340. As it goes up, raise the stop-so now to 8265
We went short below 8265-
Steps down:7960- 7660.
Now: 8040 is a support line, so if it goes above, it might correct up- and it will be along again/
Reached 2088- now raise stop to 2075- we will short again below.
KLSE: stop was 1638. Failed to go to 1643, reversed at 1640- sign of weakness, we went short below 1638.
DAX: stop was 10200- we went short below. Now at 8527. Lower stop to 9650-with all the ”action” did not break Feb 24th low!
S&P: future: target given on the 22nd was 2110- actually it went 10 point higher, and with BREXIT fell 120 points. If you were short, now you must be a millionaire… As I write now, 3 pm it is at 2028. 1/3 correction of the last 4 months’ rally is 1996… In my weekly reports, I wrote, that we will turn short below 2025- now it’s time. We are long above 2025- or short below.
5:45 pm S&P: raise stop to 2052- targets 2057-2064. Failing to go above, will fall back and we will turn short.
June 26
Ta25: At the opening it fell to 1381.45- far too exaggerated fall! 3.67%. Targets up: to close this fall: 1386-1390-1391.50-1392-1396.
failing to reach any of the targets, it will fall back.
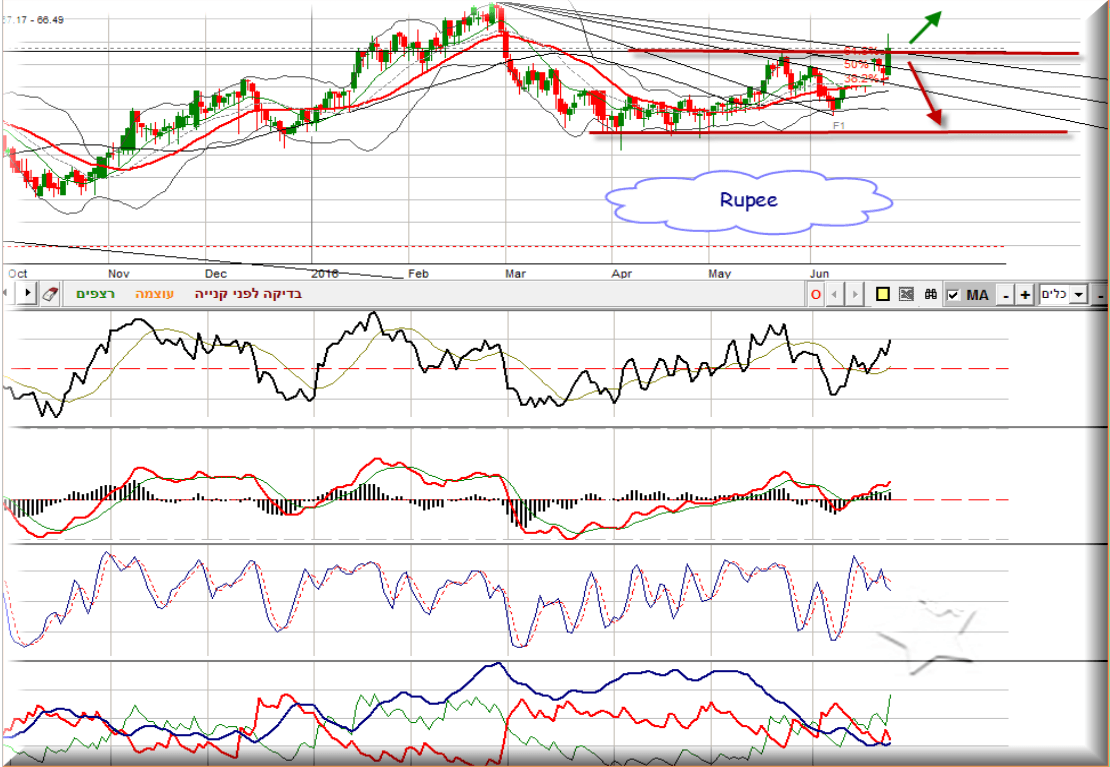
Russian rubal: short below 66.50
Indian Rupee long only above 67.80
Dollar-Yen: we are short below 103. The Japanese government interferes all the time, I stopped trading it.
All my calculations are based on planetary cycles, positions . I also use Gann, and technical analysis.
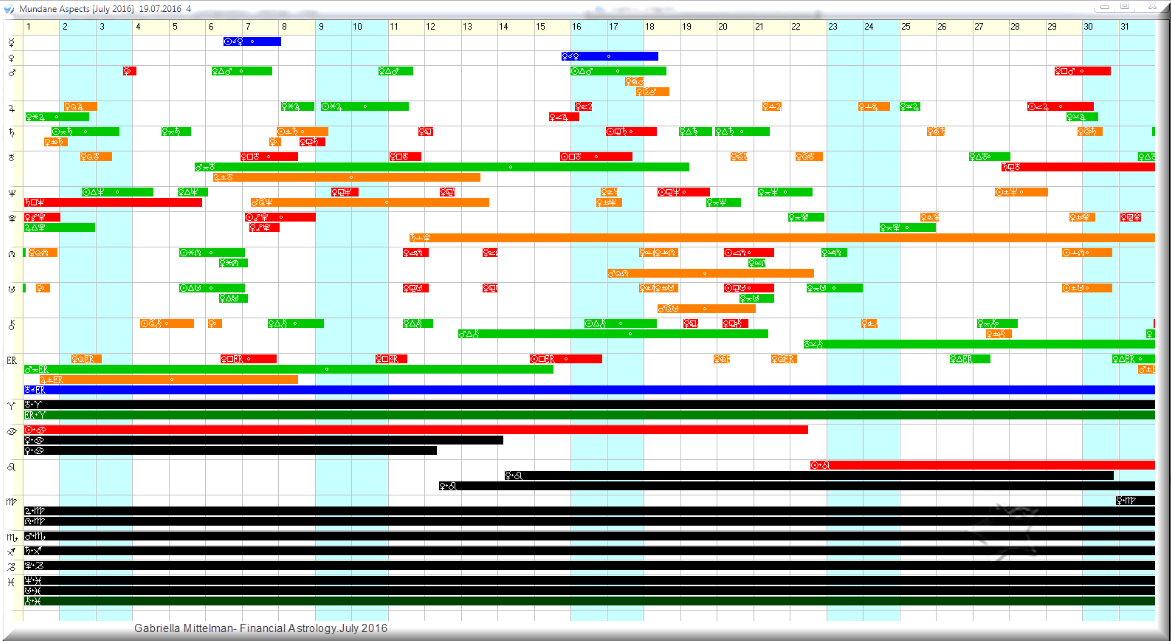
What to expect in July 2016:
As you can see, the long green line from July 5 to 19th, that is Mars-Uranus angle. In my calculations I use them to see if an index supported or not by them.
We are having a Saturn-Neptune square in the sky, at 12 degrees. This position is supporting, but it fades away on July 6th, one day after market restarts in the US. So we might find ourselves blocked below their supportive line, which will turn into resistance.
July aspects in the sky.
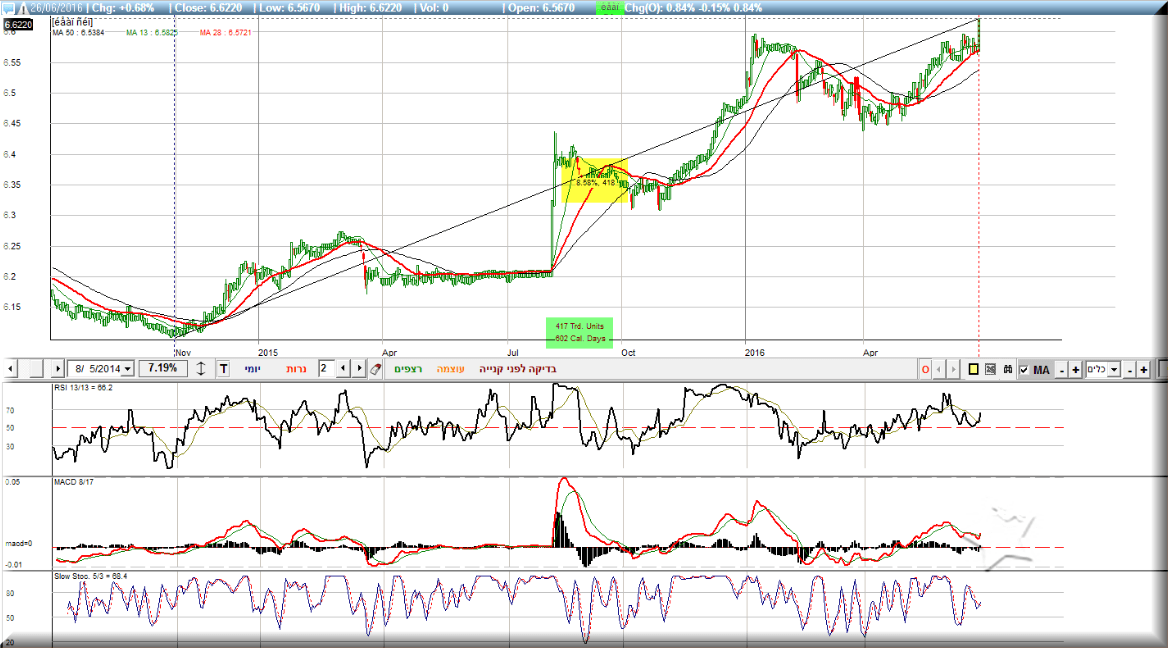
I posted today rare graphs:
The Yuan was 8.287 on July 22, 2005, and fell to 6.07 till 2013. Now it trades at 6.62-
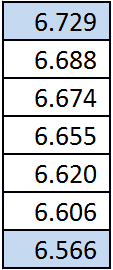
One of the calculations I make give the following price levels:
Indian Rupee: Is long above 67.80 only.
Will be glad to hear from you,
Yours sincerely,
Gabriella Mittelman
Author

Gabriella Mittelman
Astrology and the Markets


