Top 3 Price Prediction Bitcoin, Ethereum, Ripple: Are your bags packed for FOMO season? pt.2
|- Bitcoin maintains a steep uptrend rally throughout the weekend as volume continues to pour into the market.
- Ethereum price shows bullish strength as price targets$2,000 ETH.
- Ripple price underperforms. A dual scenario is in the cards that investors should be aware of.
The cryptocurrency market shows promising potential for more gains to come. Key levels have been identified.
Bitcoin price shows all signs are a go
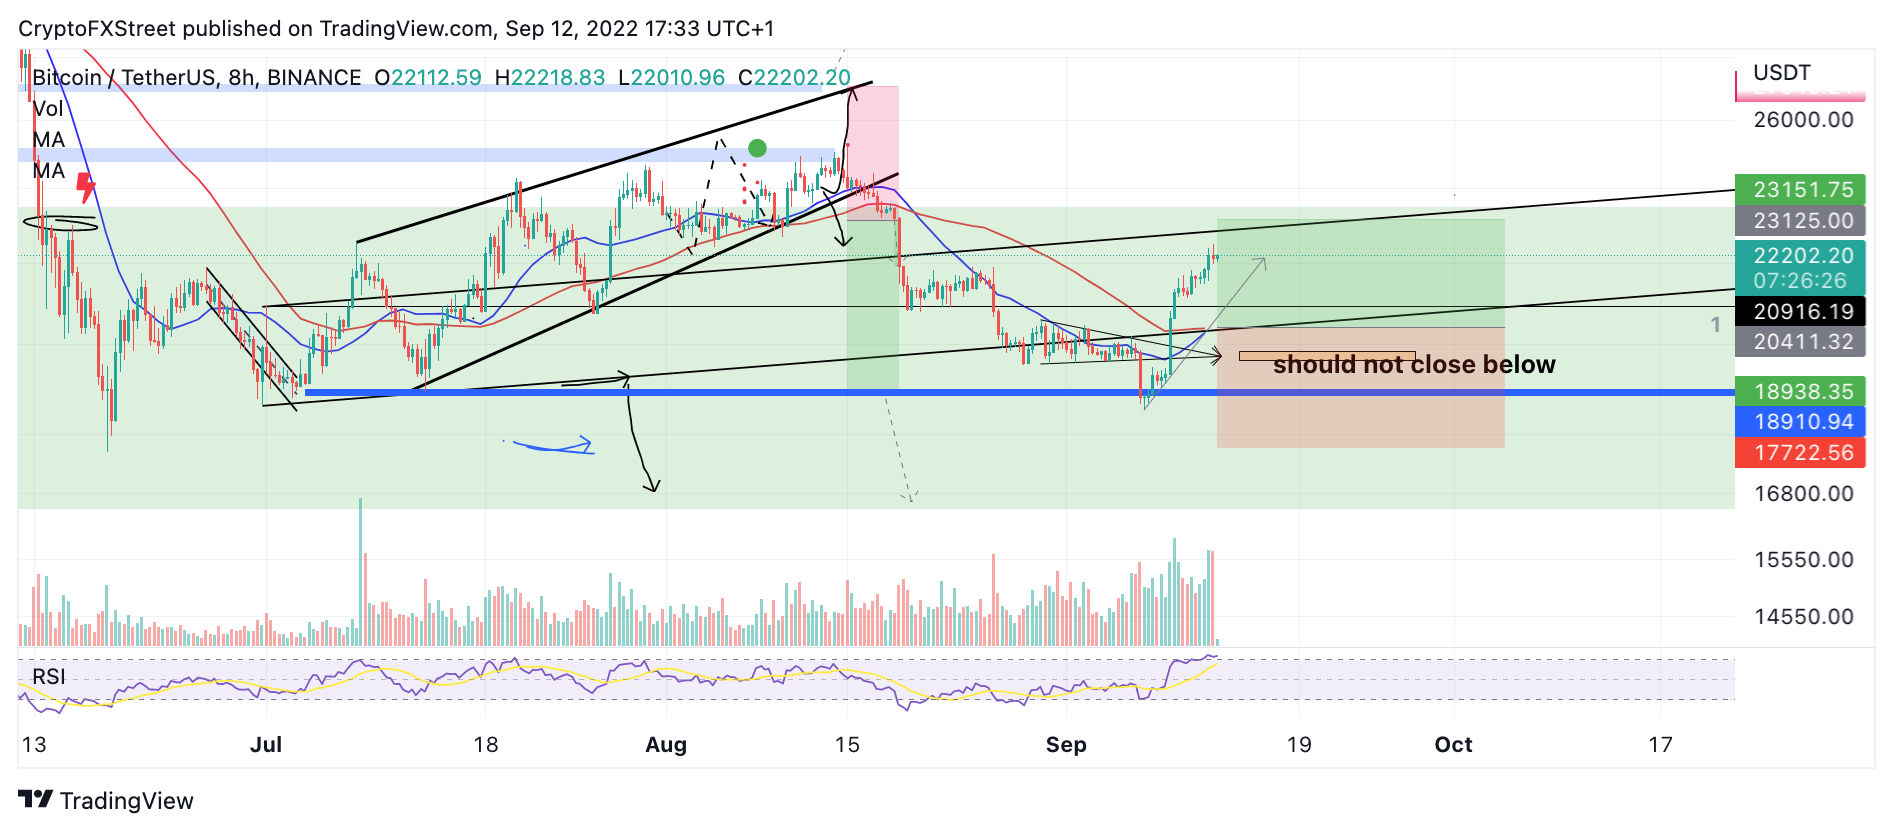
Bitcoin price currently auctions at $22,130 as the peer-to-peer digital currency is currently up 20% since reacquainting with the mid $18,000 barrier last week. The uptrend has a slope of 64 degrees, steeper than all the uptrend rallies experienced throughout the summer. The bulls have hurdled both the 8-day exponential and 21-day simple moving averages.
Santiment's Volume Profile Indicator shows a significant uptick in volume amidst the 20% rally. Based on Wyckoff's Methodology, the volume can be used to forecast the likelihood of a continuation of a trend. The Volume Profile is just a few million transactions less than the initial 40% rally's volume influx that occurred throughout the summer.
Santiment's Price & Volume Profile Indicators
When combining all of these factors, the Bitcoin price looks very promising. Investors looking to enter the market should remember that this uptrend could make an additional 35% increase towards $29,000. The invalidation point, however, is contingent upon the June 18 swing low of $17,622 remaining as support.
BTC USDT
In the following video, our analysts deep dive into the price action of Bitcoin, analyzing key levels of interest in the market. -FXStreet Team
Ethereum price has potential
Ethereum price is currently facing resistance, as the bears are forging a defensive counterattack to start the second trading week of September. The bulls have managed to rally 16% since the July 7 sell-off when the Ethereum price fell below $1,500. Currently, the Ethereum price looks very optimistic, providing a few supporting factors.
Ethereum price currently auctions at $1,712 as a profit-taking consolidation is occurring near a newly established ascending trend channel. The upper bound of the trend channel continues to provide support hinting at the bullish strength. The Volume Profile Indicator shows fewer transactions occurring during this resistance period than during the 16% rally.
If the bulls truly control, the Ethereum price could rally towards Fibonacci projections near $2,050 inn the coming days. Invalidation of the uptrend rally could be marked at $1,606. If the bears breach this level, the entire uptrend would be in jeopardy. A 20% decline would be on the table, targeting the 200-week moving average of $1,330 in the short term.
ETH USDT
In the following video, our analysts deep dive into the price action of Ethereum, analyzing key levels of interest in the market. -FXStreet Team
Ripple price continues to underperform
XRP price currently auctions $0.35 as the bulls have managed to conquer 10% since the September 7 liquidation day. Despite the optimistic retaliation, the volume is much less substantial when compared to its Ethereum and Bitcoin counterparts.
Last week, a short-term bullish outlook provided a scenario where the XRP price could retrace towards $0.36 and still be within the context of a large bearish trend. Now that the short-term play has been actualized, traders may want to consider playing it safe with the digital remittance token.
If the bulls truly control the trend, they should be able to breach the $0.41 barrier with relative ease in the coming days. Upon doing so, a rally towards $0.48 could occur. For safety, this thesis suggests waiting for confirmation by missing out on the initial 15% of the prospective rally. In doing so, traders could confidently avoid the opposing scenario still in the cards.
XRP USDT
The opposing scenario
If the current uptrend move is just a smart money trap, Ripple’s XRP price could witness a sharp 30% decline targeting $0.29 in the short term. A failure to hold above the 21-day simple moving average at $0.34 could prove that the bearish scenario is underway.
In the following video, our analysts deep dive into the price action of Ripple, analyzing key levels of interest in the market. -FXStreet Team
Information on these pages contains forward-looking statements that involve risks and uncertainties. Markets and instruments profiled on this page are for informational purposes only and should not in any way come across as a recommendation to buy or sell in these assets. You should do your own thorough research before making any investment decisions. FXStreet does not in any way guarantee that this information is free from mistakes, errors, or material misstatements. It also does not guarantee that this information is of a timely nature. Investing in Open Markets involves a great deal of risk, including the loss of all or a portion of your investment, as well as emotional distress. All risks, losses and costs associated with investing, including total loss of principal, are your responsibility. The views and opinions expressed in this article are those of the authors and do not necessarily reflect the official policy or position of FXStreet nor its advertisers.