EUR/USD rebound from 2019 lows, back around 1.1280
|- The pair moved lower and printed yearly lows near 1.1230.
- The greenback is now easing from YTD peaks post-data.
- Big miss in January US Industrial Production.
Volatility remains the name of the game so far at the end of the week, as EUR/USD has now advanced to the 1.1280/85 band after briefly recording fresh 2019 lows in the boundaries of 1.1230.
EUR/USD bid after US data
Risk-on sentiment remains well and sound in the second half of the week, although the sentiment around the single currency stays depressed amidst the ongoing rally in the buck, all following recent progress from the US-China trade talks.
After briefly recording fresh yearly lows in the 1.1235/30 band, spot met a wave of buying orders following the big miss in US Industrial Production, which contracted at a monthly 0.6% in January. Further data saw Capacity Utilization dropping to 78.2% and Manufacturing Production retreating 0.9% inter-month, all prints coming in below previous estimates.
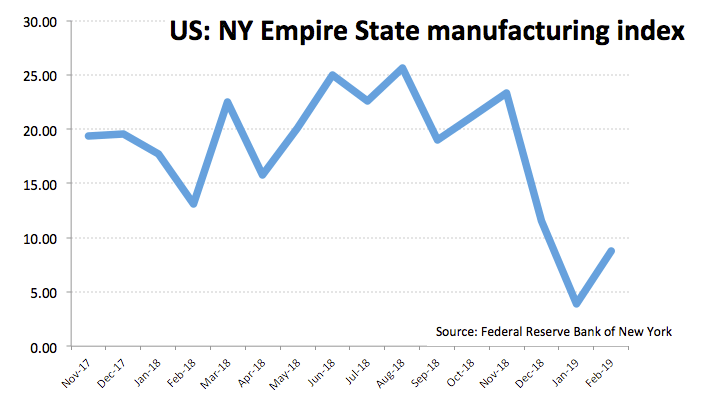
On the brighter side, the regional manufacturing gauge measured by the Empire State index rose above estimates to 8.80 for the current month.
What to look for around EUR
The offered bias in the shared currency remains well and sound this week in spite of some progress made in the US-China trade talks and agreement to resume negotiations next week. The slowdown in the euro bloc keeps weighing on sentiment so far, adding to the ongoing speculations that the ECB could refrain from acting on rates this year and extend further, instead, the current ‘pause-mode’. In addition, political concerns remain well and sound in Euroland as we get closer to the EU parliamentary elections: snap elections in Spain on April 28, the still unresolved issue of the ‘yellow vests’ in France and the omnipresent effervescence in the Italian political scenario, all appear to be lending support to the idea of swelling populism in the Old Continent.
EUR/USD levels to watch
At the moment, the pair is losing 0.18% at 1.1273 and a break below 1.1234 (2019 low Feb.15) would target 1.1215 (2018 low Nov.12) en route to 1.1118 (monthly low Jun.20 2017). On the flip side, the next up barrier emerges at 1.1294 (100-hour SMA) seconded by 1.1332 (200-week SMA) and finally 1.1341 (high Feb.13).
Information on these pages contains forward-looking statements that involve risks and uncertainties. Markets and instruments profiled on this page are for informational purposes only and should not in any way come across as a recommendation to buy or sell in these assets. You should do your own thorough research before making any investment decisions. FXStreet does not in any way guarantee that this information is free from mistakes, errors, or material misstatements. It also does not guarantee that this information is of a timely nature. Investing in Open Markets involves a great deal of risk, including the loss of all or a portion of your investment, as well as emotional distress. All risks, losses and costs associated with investing, including total loss of principal, are your responsibility. The views and opinions expressed in this article are those of the authors and do not necessarily reflect the official policy or position of FXStreet nor its advertisers.