Uniswap Price Prediction: UNI bulls try to shift the odds in their favor
|- UNI is currently trading at $3.17, trying to recover from the extended pullback to $2.47.
- The bulls are taking control of the short-term timeframes and are eying up $4.
Uniswap started trading as high as $7 on its first day but quickly fell off due to the intense selling pressure. The digital asset reached a $700 million market capitalization on September 18. Despite the downtrend, the market cap has increased again to $641 million due to more circulating supply.
UNI bulls eying up $4 in the short-term
Uniswap has been trading between $2.4 and $3.7 for around two weeks now. It seems that investors aren't sure in which direction the digital asset is going next. UNI's price has established a higher low at $2.88 compared to the low of $2.47, a positive step for the bulls.
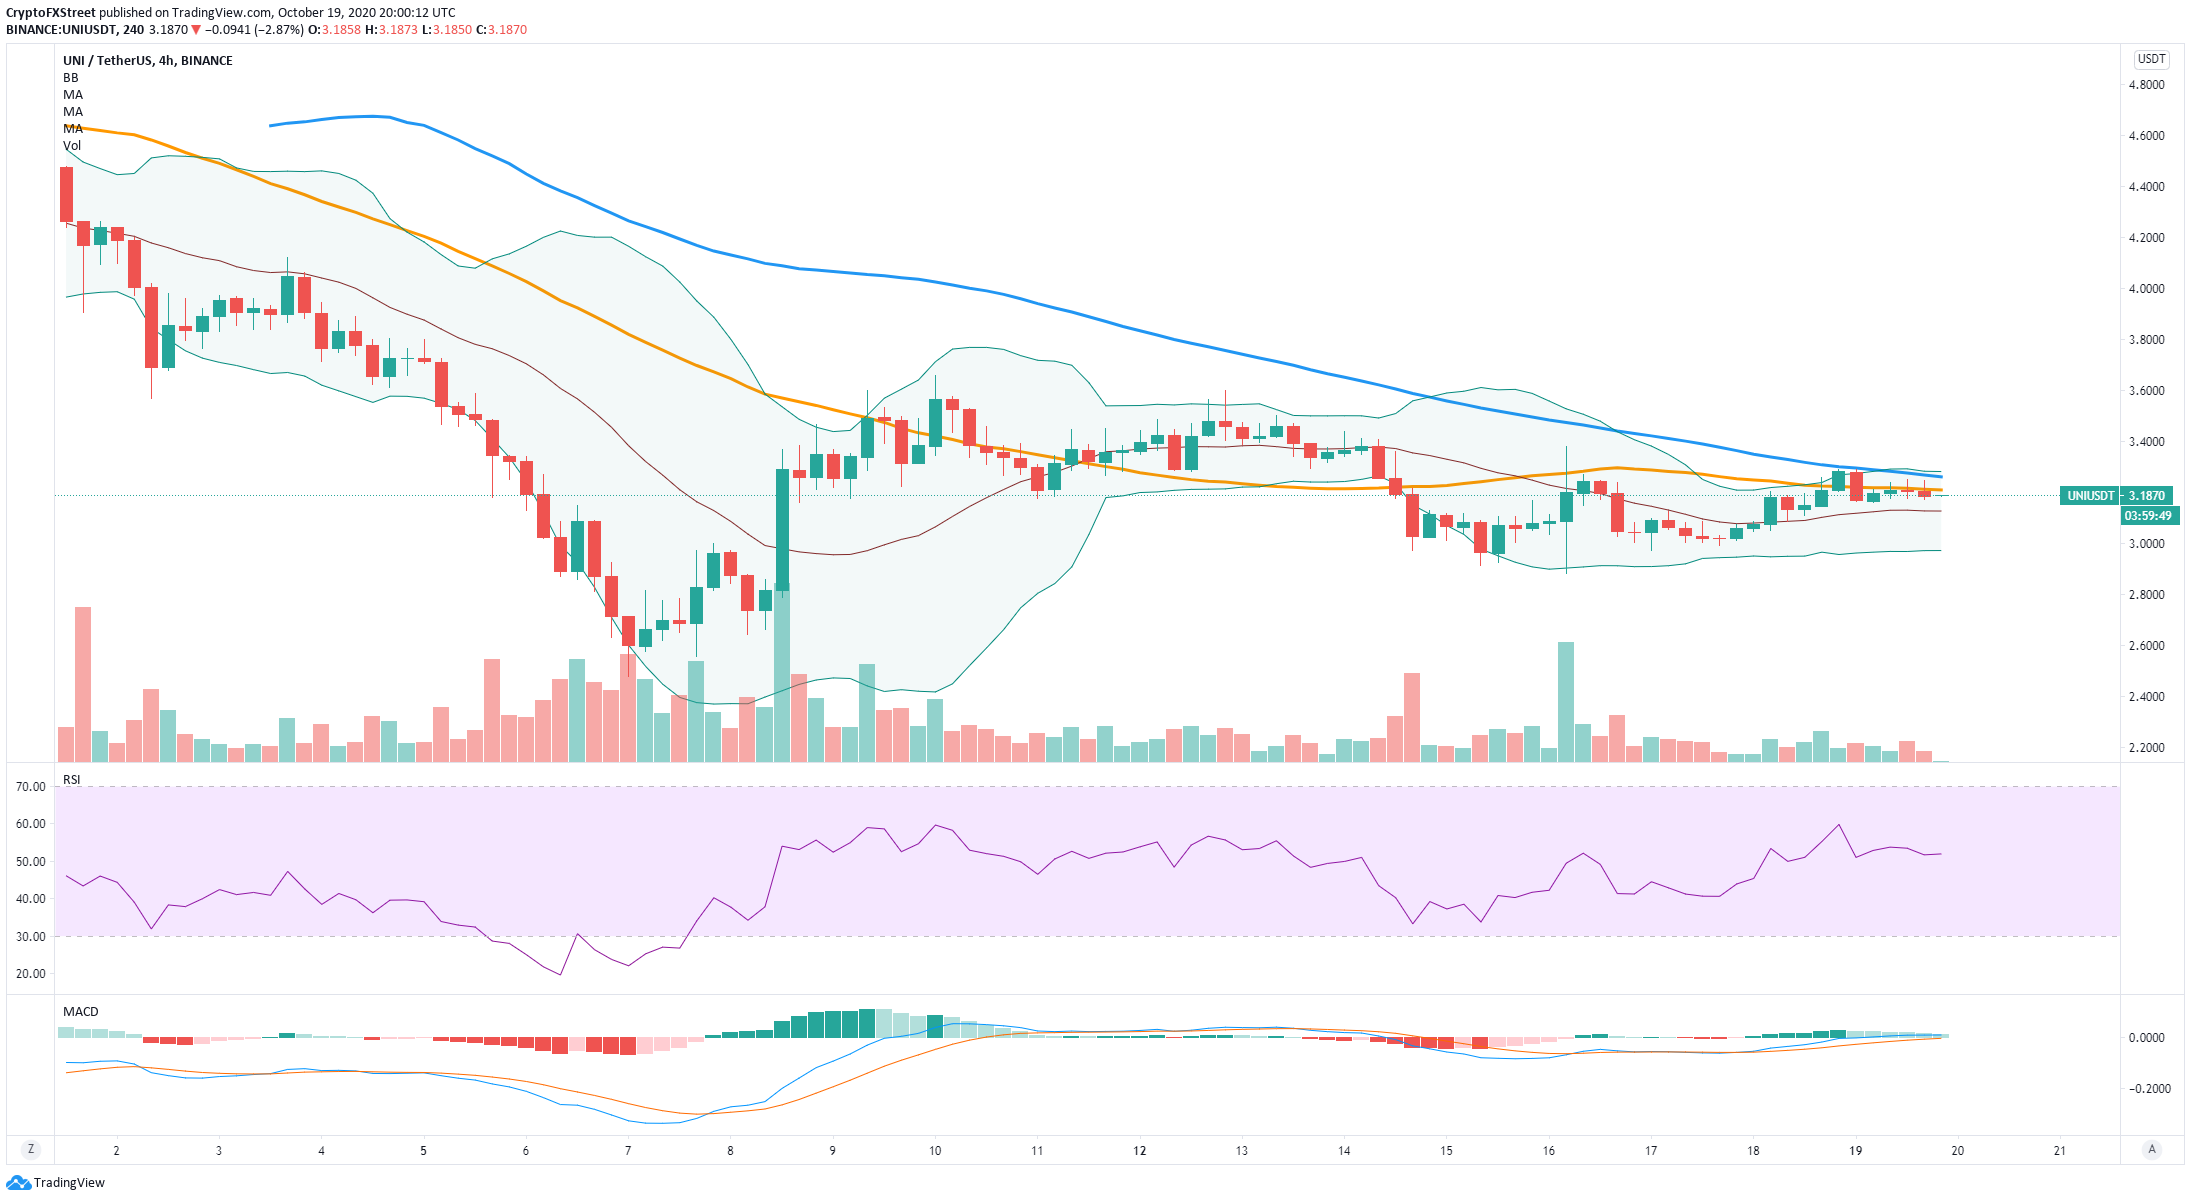
UNI/USDT 4-hour chart
On the 4-hour chart, UNI has formed several higher lows and higher highs, confirming an uptrend. The next hurdle on the way up is the 50-SMA at $3.2, followed by the 100-SMA at $3.3. The Bollinger Bands are also squeezing again, indicating that a potential significant move is underway.
UNI's trading volume is also declining, another primary indicator that a spike in the price is nearby. A breakout above $3.2 and $3.3 can easily push the digital asset up to the last daily high of $3.65 and potentially to the psychological level at $4 as there is very little resistance to the upside.
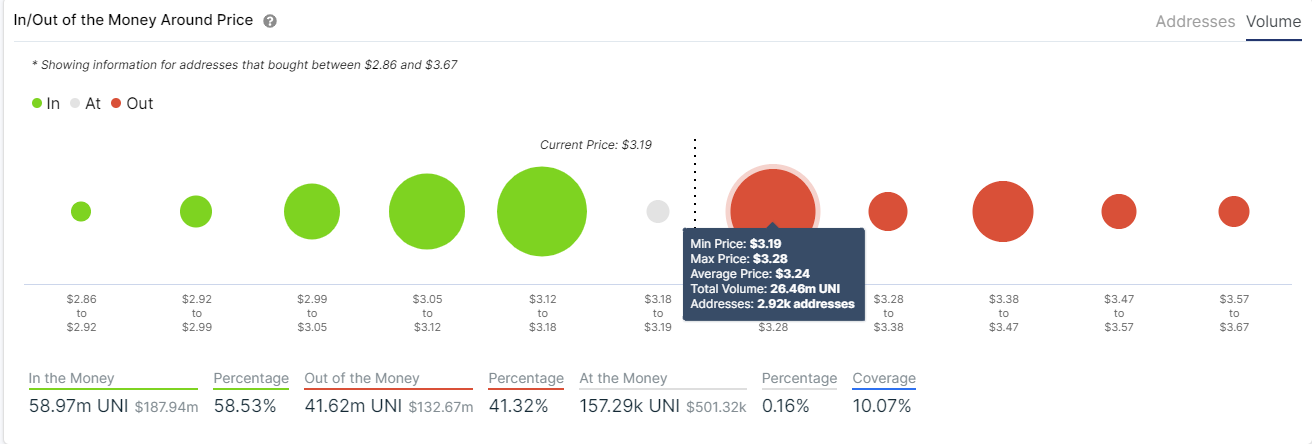
UNI IOMAP Chart
The In/Out of the Money Around Price chart seems to confirm this theory showing a substantial resistance area between $3.19 and $3.28, where 26 million UNI tokens were bought. In comparison, the support of UNI until $2.99 is far stronger than the resistance above.
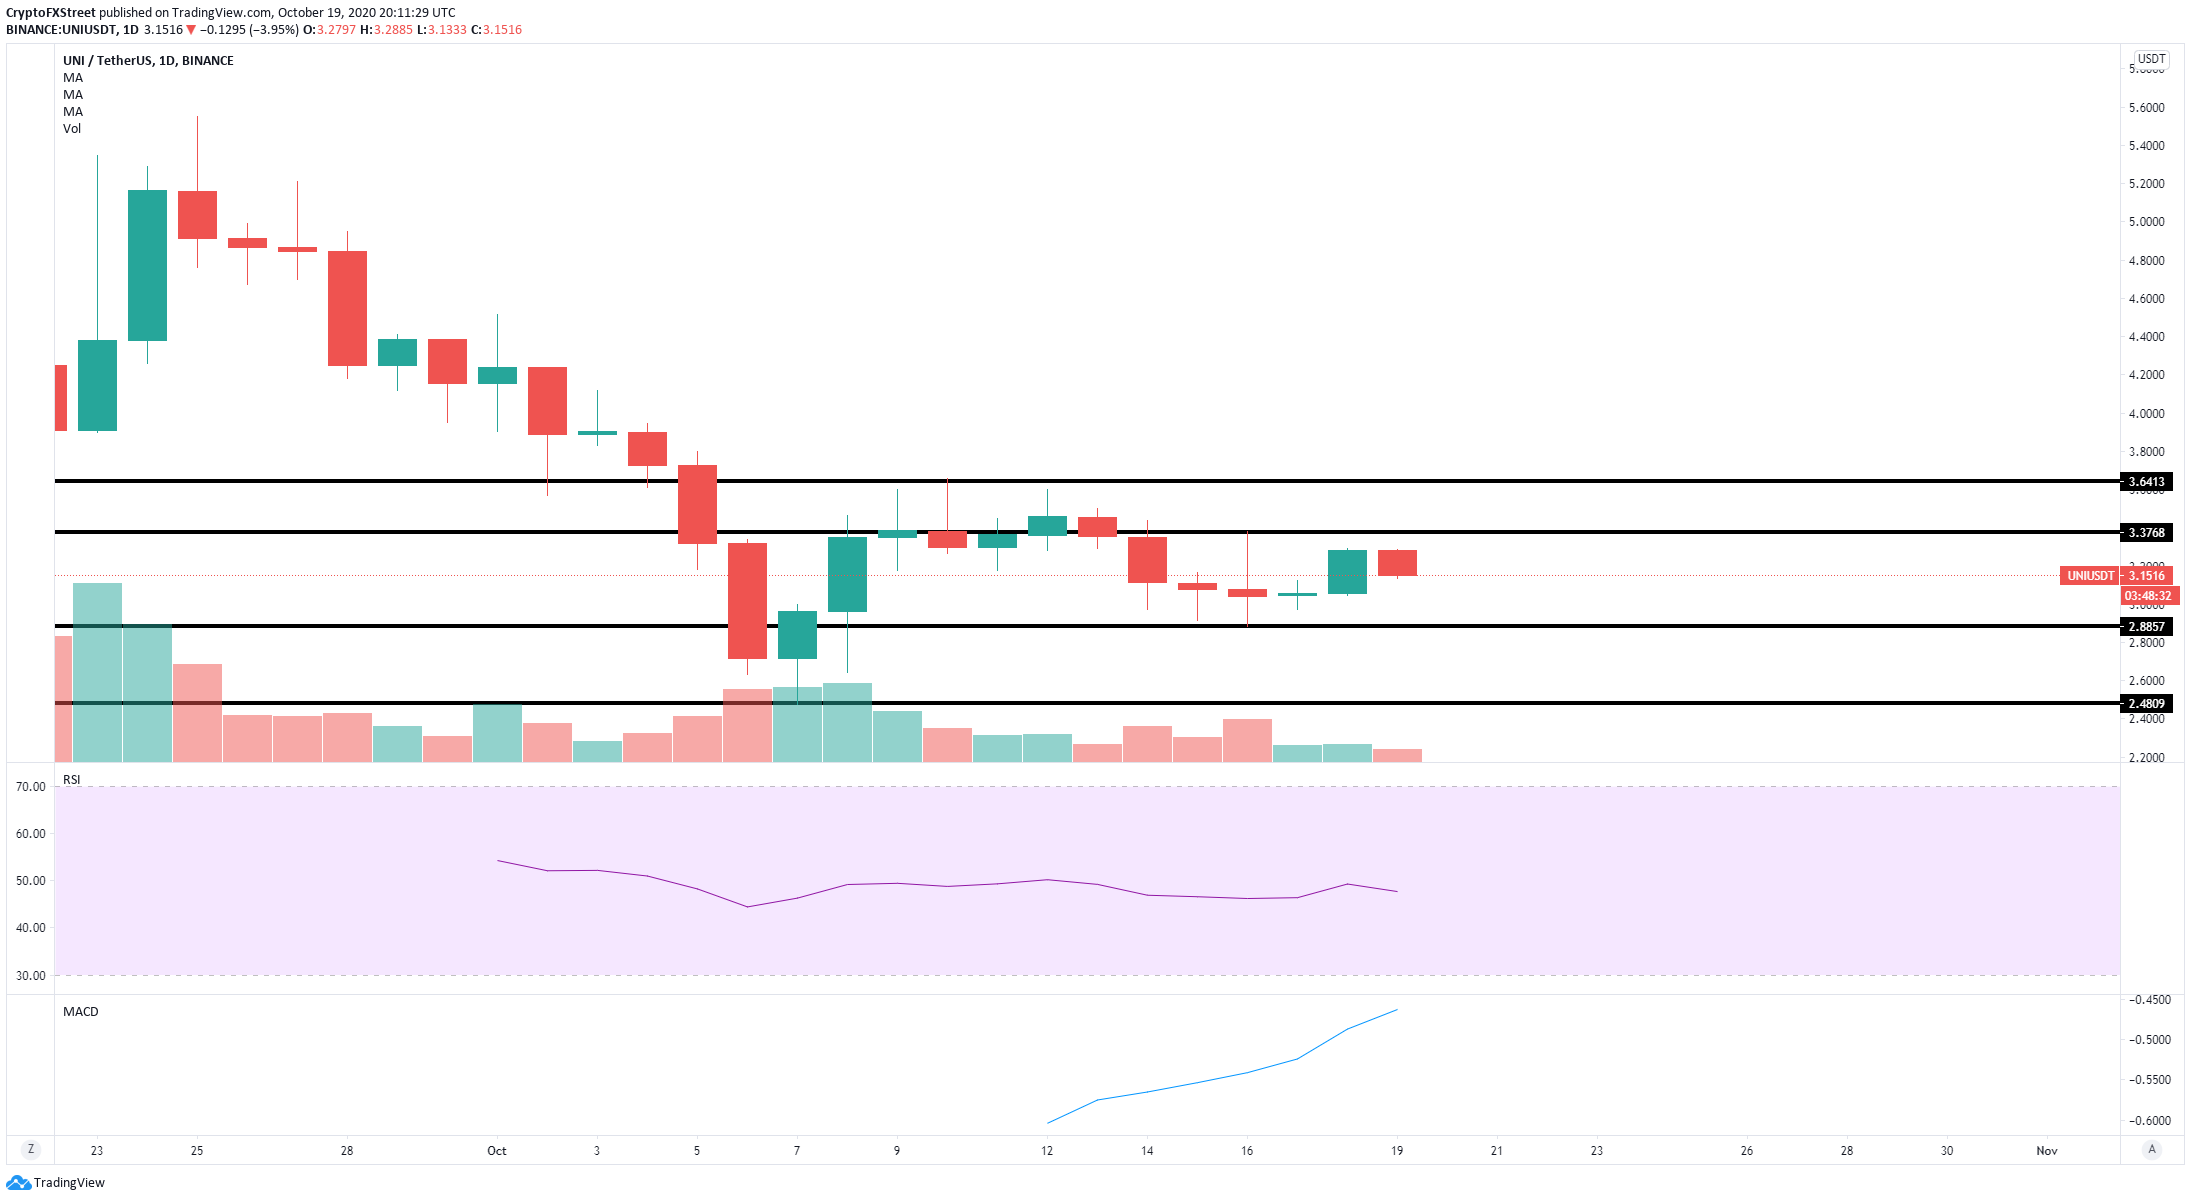
UNI/USDT daily chart
The daily chart seems to be forming an equilibrium pattern with a lower high and a higher low. This also supports the theory that UNI is close to a considerable breakout; however, bears are the favorite here considering the extended downtrend on the daily chart.
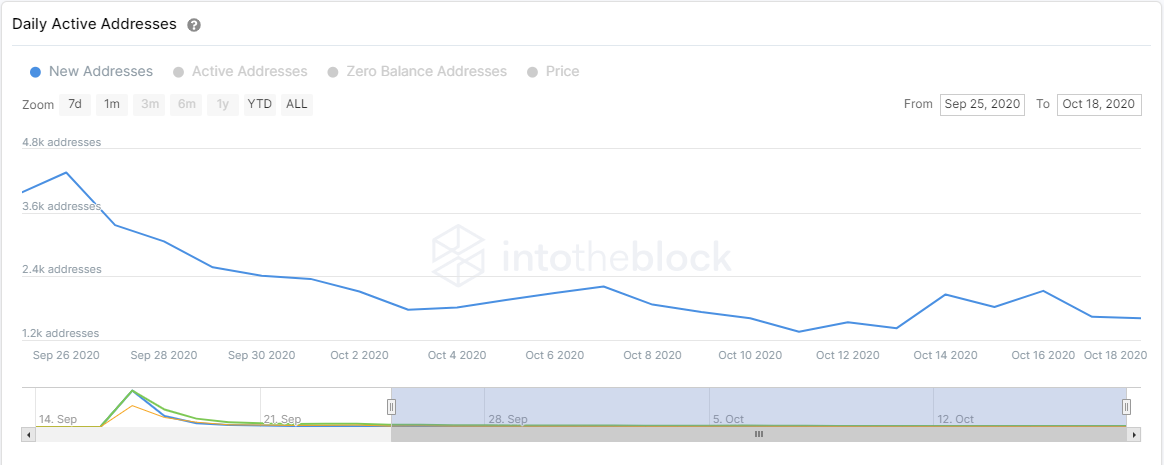
UNI New Addresses Chart
Despite a small increase on October 14, the number of new UNI addresses joining the network has been in a downtrend since September 15. The price of the digital asset is up 3% in the past two days; however, the number of new addresses is down. A bearish breakout below $2.88 can easily send UNI towards $2.48 and then $2.
Key price points for UNI
We know the digital asset is close to a massive breakout. Bulls are eying up at least $3.65 if UNI can climb above $3.3. The digital asset could potentially go as high as $4 in the longer term as there is very little resistance above $3.3, according to the IOMAP chart.
On the bearish side, the daily equilibrium pattern seems to be favoring the sellers after quite a prolonged downtrend. A bearish breakout below the critical support level at $2.88 can drive UNI's price towards $2.48 and the psychological level at $2.
Information on these pages contains forward-looking statements that involve risks and uncertainties. Markets and instruments profiled on this page are for informational purposes only and should not in any way come across as a recommendation to buy or sell in these assets. You should do your own thorough research before making any investment decisions. FXStreet does not in any way guarantee that this information is free from mistakes, errors, or material misstatements. It also does not guarantee that this information is of a timely nature. Investing in Open Markets involves a great deal of risk, including the loss of all or a portion of your investment, as well as emotional distress. All risks, losses and costs associated with investing, including total loss of principal, are your responsibility. The views and opinions expressed in this article are those of the authors and do not necessarily reflect the official policy or position of FXStreet nor its advertisers.