Gold Weekly Forecast: XAU/USD looks set to hit the $1800 resistance
|- Gold has moved 1.3% higher on the week so far leading into the close.
- This could be the third straight week of gains for the yellow metal.
Gold weekly chart
The risk situation in the equities markets has been precarious this week. There has been stages of USD weakness as well as the weakness in stocks like we have seen on Friday. Looking at the chart below, it is clear to see the USD 1800 per troy ounce level is the next resistance zone. This level was used to great effect on the left-hand side of the chart after gold hit its all-time highs. It was the previous consolidation top and there were three very strong rejections before the subsequent sell-off preceded.
The Relative Strength Index indicator is showing a divergence but if that red trendline breaks its game on and the market could test the all-time highs. The issue is that when stocks sell-off the dollar rallies capping gains in the precious metal. If there is to be a point when the USD and equities fall at the same time then gold could hit the roof.
-637287877570017459.png)
Gold daily chart
The daily chart Fibonacci extensions are showing there is a massive confluence level at the USD 1800 per troy ounce psychological resistance zone. The Relative Strength Index was also showing a very similar divergence to the weekly but the trendline has now been broken and the price moved higher.
If there is to be a meaningful retracement then USD 1675.40 could be a decent zone where the buyers step back in. It has been used many times and even made an appearance on the weekly chart above.
Over the weekend, the market is sure to get some more news on the coronavirus pandemic from the US. If there is to be a weekend gap then depending on how bad the news is, it could be to the upside.
-637287882440245253.png)
Poll result
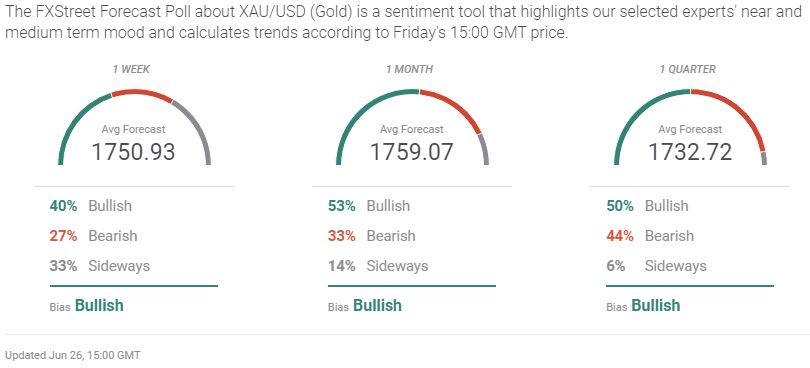
Additional levels
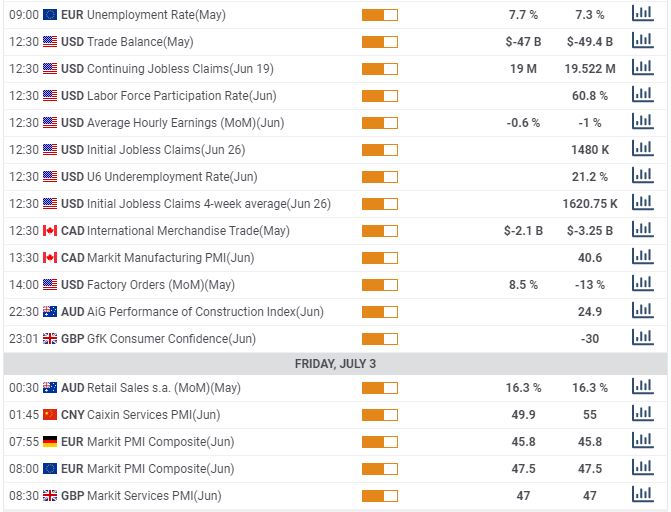
Calendar
Next week the market will get the latest NFP data as well as Chinese manufacturing PMI's. Both of these have the potential to move the markets and cause volatility.
High impact events
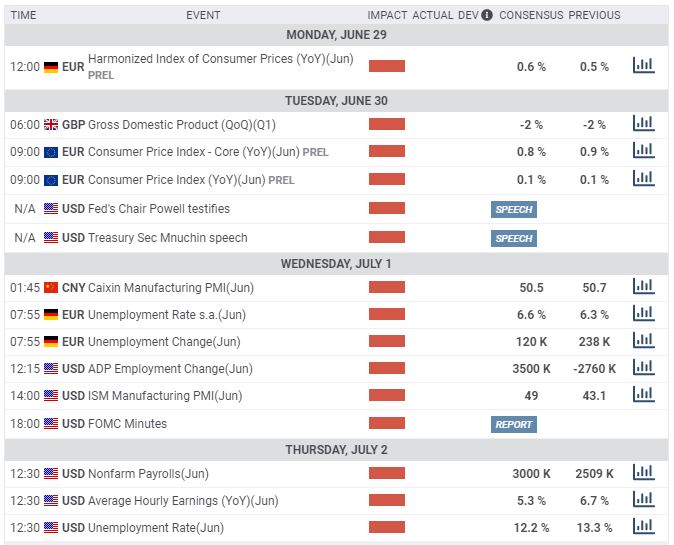
Medium impact events
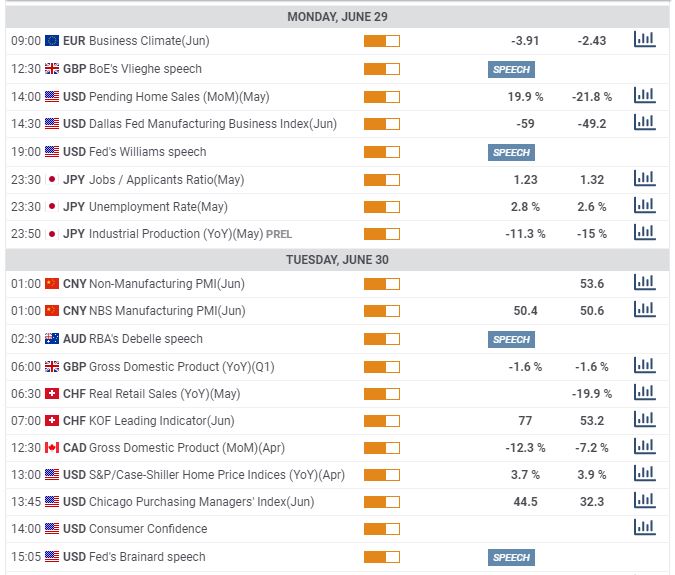
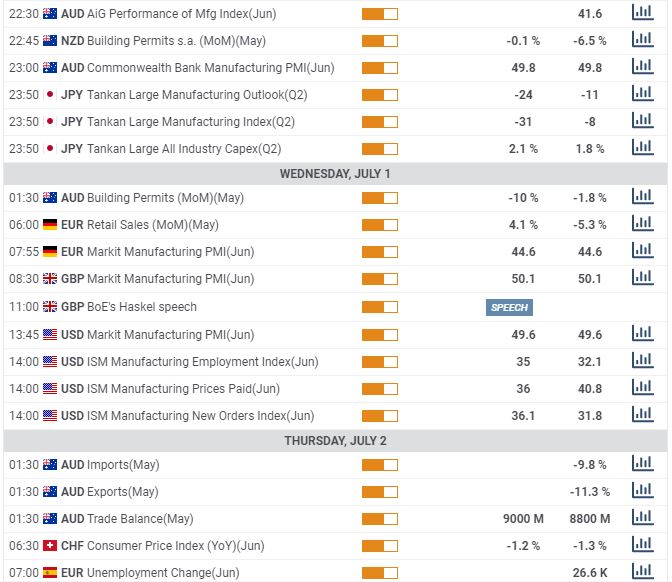
Information on these pages contains forward-looking statements that involve risks and uncertainties. Markets and instruments profiled on this page are for informational purposes only and should not in any way come across as a recommendation to buy or sell in these assets. You should do your own thorough research before making any investment decisions. FXStreet does not in any way guarantee that this information is free from mistakes, errors, or material misstatements. It also does not guarantee that this information is of a timely nature. Investing in Open Markets involves a great deal of risk, including the loss of all or a portion of your investment, as well as emotional distress. All risks, losses and costs associated with investing, including total loss of principal, are your responsibility. The views and opinions expressed in this article are those of the authors and do not necessarily reflect the official policy or position of FXStreet nor its advertisers.