- Gold has moved 1.3% higher on the week so far leading into the close.
- This could be the third straight week of gains for the yellow metal.
Gold weekly chart
The risk situation in the equities markets has been precarious this week. There has been stages of USD weakness as well as the weakness in stocks like we have seen on Friday. Looking at the chart below, it is clear to see the USD 1800 per troy ounce level is the next resistance zone. This level was used to great effect on the left-hand side of the chart after gold hit its all-time highs. It was the previous consolidation top and there were three very strong rejections before the subsequent sell-off preceded.
The Relative Strength Index indicator is showing a divergence but if that red trendline breaks its game on and the market could test the all-time highs. The issue is that when stocks sell-off the dollar rallies capping gains in the precious metal. If there is to be a point when the USD and equities fall at the same time then gold could hit the roof.
-637287877570017459.png)
Gold daily chart
The daily chart Fibonacci extensions are showing there is a massive confluence level at the USD 1800 per troy ounce psychological resistance zone. The Relative Strength Index was also showing a very similar divergence to the weekly but the trendline has now been broken and the price moved higher.
If there is to be a meaningful retracement then USD 1675.40 could be a decent zone where the buyers step back in. It has been used many times and even made an appearance on the weekly chart above.
Over the weekend, the market is sure to get some more news on the coronavirus pandemic from the US. If there is to be a weekend gap then depending on how bad the news is, it could be to the upside.
-637287882440245253.png)
Poll result
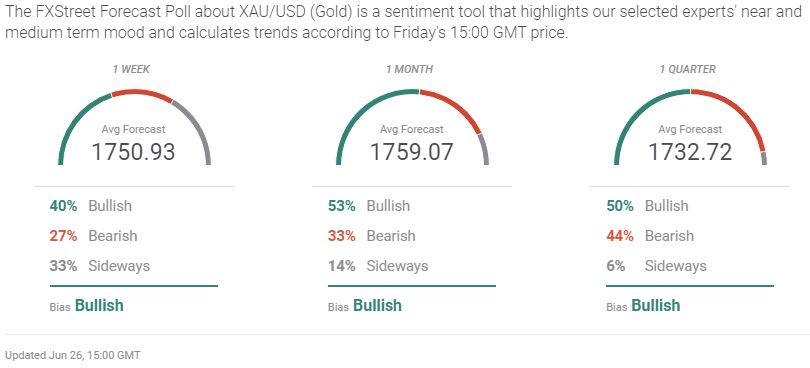
Additional levels
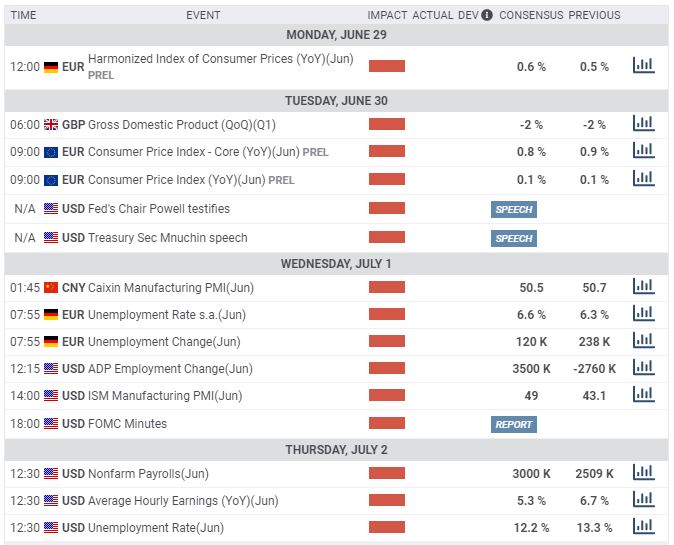
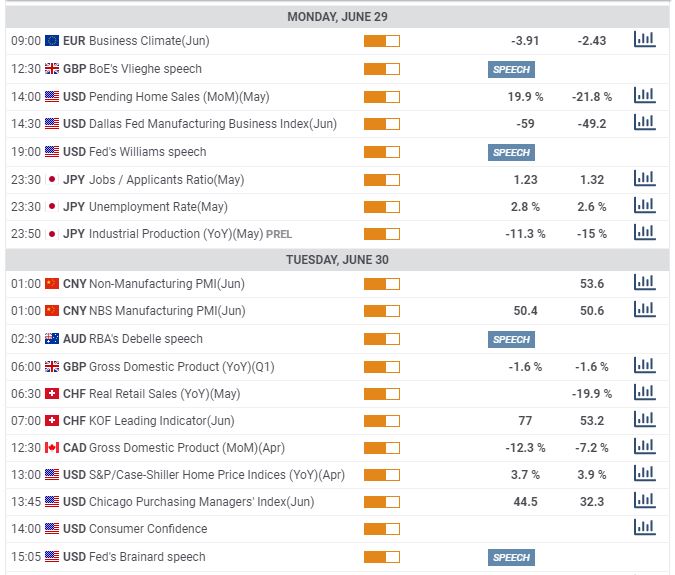
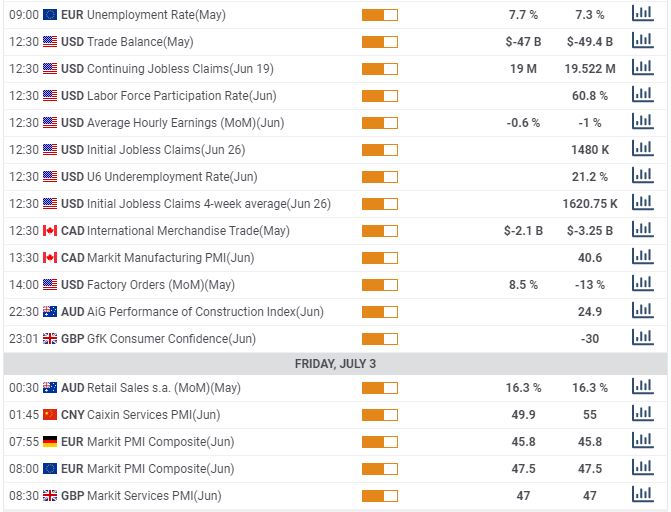
Calendar
Next week the market will get the latest NFP data as well as Chinese manufacturing PMI's. Both of these have the potential to move the markets and cause volatility.
High impact events
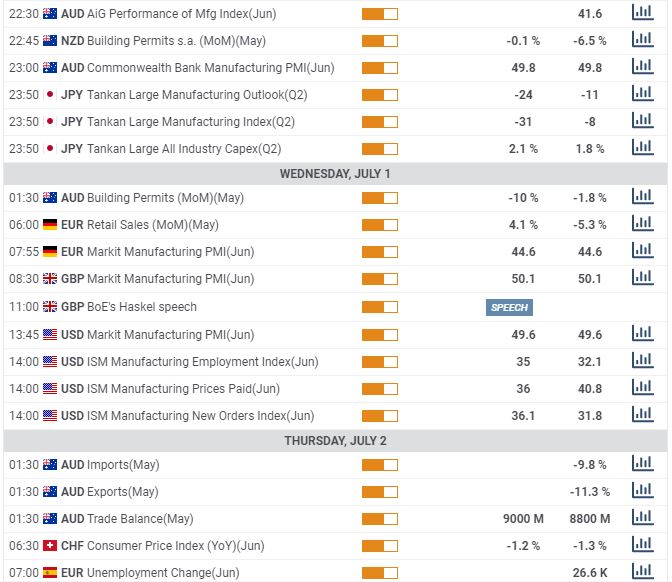
Medium impact events
All information and content on this website, from this website or from FX daily ltd. should be viewed as educational only. Although the author, FX daily ltd. and its contributors believe the information and contents to be accurate, we neither guarantee their accuracy nor assume any liability for errors. The concepts and methods introduced should be used to stimulate intelligent trading decisions. Any mention of profits should be considered hypothetical and may not reflect slippage, liquidity and fees in live trading. Unless otherwise stated, all illustrations are made with the benefit of hindsight. There is risk of loss as well as profit in trading. It should not be presumed that the methods presented on this website or from material obtained from this website in any manner will be profitable or that they will not result in losses. Past performance is not a guarantee of future results. It is the responsibility of each trader to determine their own financial suitability. FX daily ltd. cannot be held responsible for any direct or indirect loss incurred by applying any of the information obtained here. Futures, forex, equities and options trading contains substantial risk, is not for every trader, and only risk capital should be used. Any form of trading, including forex, options, hedging and spreads, contains risk. Past performance is not indicative of future FX daily ltd. are not Registered Financial Investment Advisors, securities brokers-dealers or brokers of the U.S. Securities and Exchange Commission or with any state securities regulatory authority OR UK FCA. We recommend consulting with a registered investment advisor, broker-dealer, and/or financial advisor. If you choose to invest, with or without seeking advice, then any consequences resulting from your investments are your sole responsibility FX daily ltd. does not assume responsibility for any profits or losses in any stocks, options, futures or trading strategy mentioned on the website, newsletter, online trading room or trading classes. All information should be taken as educational purposes only.
Recommended Content
Editors’ Picks
AUD/USD favours extra retracements in the short term

AUD/USD kept the negative stance well in place and briefly broke below the key 0.6400 support to clinch a new low for the year on the back of the strong dollar and mixed results from the Chinese docket.
EUR/USD now shifts its attention to 1.0500

The ongoing upward momentum of the Greenback prompted EUR/USD to lose more ground, hitting new lows for 2024 around 1.0600, driven by the significant divergence in monetary policy between the Fed and the ECB.
Gold aiming to re-conquer the $2,400 level

Gold stages a correction on Tuesday and fluctuates in negative territory near $2,370 following Monday's upsurge. The benchmark 10-year US Treasury bond yield continues to push higher above 4.6% and makes it difficult for XAU/USD to gain traction.
Bitcoin price defends $60K as whales hold onto their BTC despite market dip

Bitcoin (BTC) price still has traders and investors at the edge of their seats as it slides further away from its all-time high (ATH) of $73,777. Some call it a shakeout meant to dispel the weak hands, while others see it as a buying opportunity.
Friday's Silver selloff may have actually been great news for silver bulls!

Silver endured a significant selloff last Friday. Was this another step forward in the bull market? This may seem counterintuitive, but GoldMoney founder James Turk thinks it was a positive sign for silver bulls.