Global stocks rally accelerates after strong Wall Street earnings
|Global stocks rallied as the market continued to focus on the ongoing earning season while the US bond yields declined. In the United States, futures tied to the Dow Jones rose by more than 130 points while the Nasdaq 100 and S&P 500 rose by more than 0.50%. In Europe, the DAX, FTSE 100, and CAC 40 also rose by more than 0.50%. This happened after banks like Goldman Sachs and JP Morgan published strong earnings. Today, in the premarket, companies like UnitedHealth, Bank of America, PepsiCo, and Citigroup also published positive results. Other forms that will release in the aftermarket are PPG, JB Hunt, and HD Supply.
The Australian dollar rose to the highest level since March this year after the relatively strong employment numbers. The Bureau of Statistics said that the unemployment rate declined to 5.6% in March after falling by 5.8% in the previous month. In the same period, the participation rate rose to 66.3% in June from the previous 66.1%. In total, the economy added more than 70.7k jobs. Looking ahead, the pair will react to the latest Chinese GDP numbers that will come out tomorrow morning. In general, analysts expect the numbers to show that the economy rebounded by 19.1% year-on-year as external demand rose.
The US dollar index declined after the US published the latest initial and continuing jobs numbers. The numbers revealed that more than 576k Americans filed for unemployment insurance last week. This was a better number than the previous 744k. Continuing claims rose to 3.731 million from 3.73 million. Meanwhile, data showed that the country’s retail sales rose by 9.8% in March after slumping by 3% in February. The core retail sales rose by 8.4% after falling by 2.7% a year earlier. Analysts expect this growth to start waning as the impacts of the stimulus start fading. Meanwhile, the New York Empire State Manufacturing Index rose from 17.40 to 26.3.
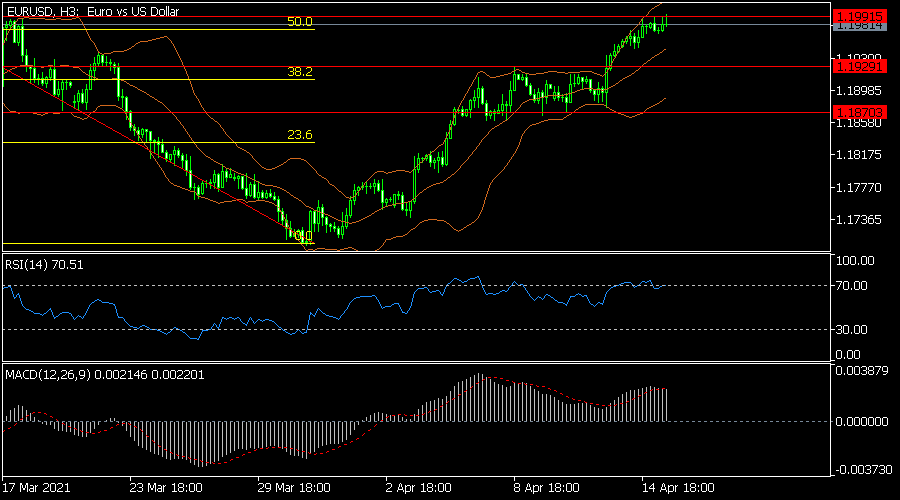
EUR/USD
The EUR/USD pair rose to 1.2000, the highest level since March 4. On the 3-hour chart, the price has moved close to the upper side of the Bollinger Bands and the 50% Fibonacci retracement level. The Relative Strength Index (RSI) has also moved above the overbought level of 70. Similarly, the histogram and signal of the MACD have also moved above the neutral level. While the bullish trend will likely remain, the pair may retest the important support at 1.1930.
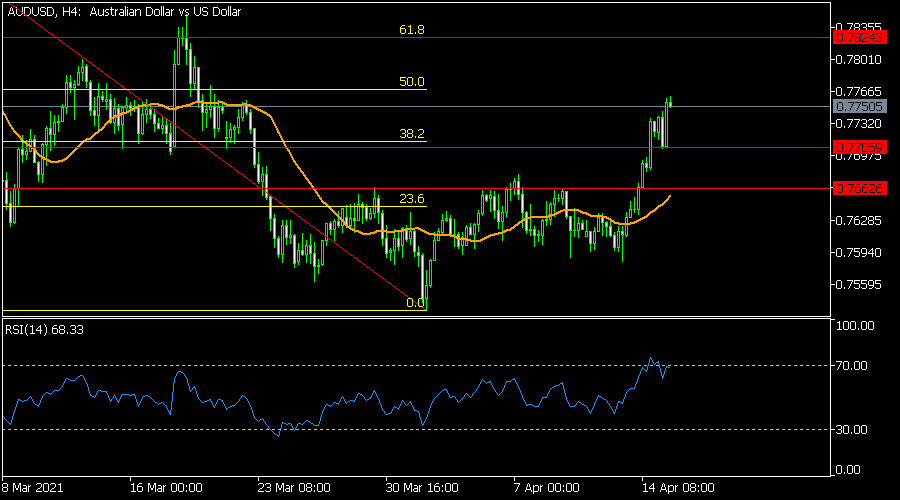
AUD/USD
The AUD/USD pair rose to a high of 0.7753, which is the highest it has been since March 20. On the four-hour chart, the price is slightly below the 50% Fibonacci retracement level and above the 25-day EMA. It has also moved above the important support at 1.7705 while the Relative Strength Index (RSI) has moved above the overbought level of 70. Therefore, the pair may keep rising, with the next level to watch being the 61.8% retracement at 0.7825.
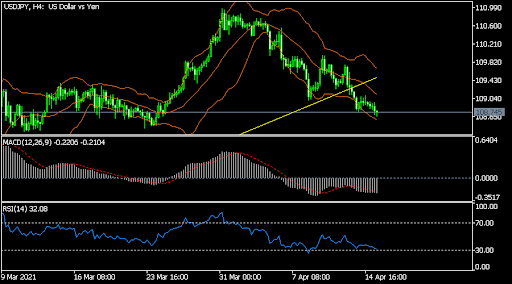
USD/JPY
The USD/JPY pair dropped to an intraday low of 108.76 after the US retail sales numbers. This was the lowest it has been since March 25. On the four-hour chart, the pair is between the lower and the lower sides of the Bollinger Bands. It is also below the two lines of the envelope indicator. Therefore, the pair may keep falling, with the next key target being at 107.85.
Information on these pages contains forward-looking statements that involve risks and uncertainties. Markets and instruments profiled on this page are for informational purposes only and should not in any way come across as a recommendation to buy or sell in these assets. You should do your own thorough research before making any investment decisions. FXStreet does not in any way guarantee that this information is free from mistakes, errors, or material misstatements. It also does not guarantee that this information is of a timely nature. Investing in Open Markets involves a great deal of risk, including the loss of all or a portion of your investment, as well as emotional distress. All risks, losses and costs associated with investing, including total loss of principal, are your responsibility. The views and opinions expressed in this article are those of the authors and do not necessarily reflect the official policy or position of FXStreet nor its advertisers.