WTI turns negative around $58.20 ahead of data
|- Prices of the WTI retreats after hitting fresh 2019 highs.
- US-China trade concerns weigh on crude oil prices.
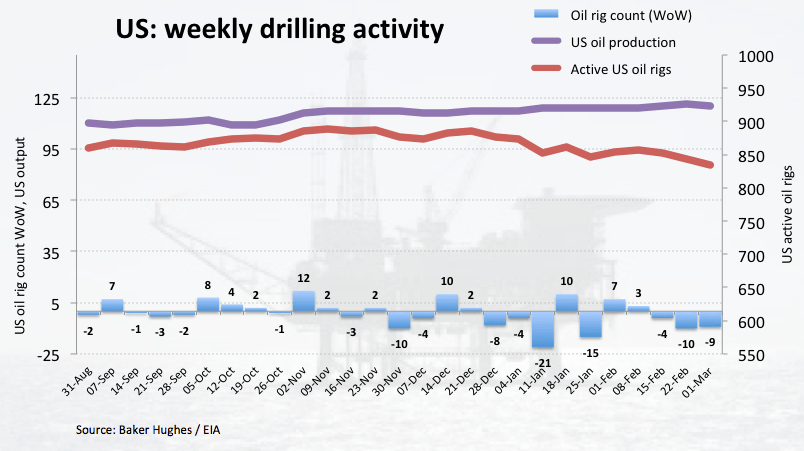
- Driller Baker Hughes’ oil rig count coming up next.
Prices of the barrel of the American reference for the sweet light crude oil are losing some ground after climbing to fresh yearly highs just below the $59.00 mark earlier in the session.
WTI looks to trade, data
Prices of the WTI seems to have met resistance in the vicinity of the $59.00 mark per barrel today following four consecutive sessions with gains.
Crude oil has faded part of the onoging sharp up move after some pessimism around the US-China trade dispute resurfaced on news that the Trump-Xi meeting has been pushed back to next month.
However, the upbeat sentiment in crude oil remains well and sound for the time being, with a larger-than-expected draw in US supplies adding extra legs to the rally, as per the latest EIA report.
Looking ahead, Baker Hughes will publish its usual weekly report on the US drilling activity later in the European evening.
What to look for around WTI
Crude oil is extending the rally and clinched fresh 2019 peaks in levels just shy of the $59.00 mark today, always bolstered by a softer buck and a generalized better tone in the risk-associated universe. The underlying bullish view in crude oil remains firm, in the meantime, on the back of the so-called ‘Saudi put’, tight conditions in the US markets (amidst US net imports in historic low levels and the rising activity in refiners ahead of the summer session), the current OPEC+ agreement to cut oil output and ongoing US sanctions against Iran and Venezuela crude oil exports. However, uncertainty around the US-China trade dispute (as per recent events) remains a threat to this view and could undermine further bullish attempts.
WTI significant levels
At the moment the barrel of WTI is down 0.45% at $58.18 facing the next support at $56.89 (10-day SMA) seconded by $55.51 (38.2% Fibo of the October-December drop) and then $54.37 (low Mar.8). On the flip side, a breakout of $58.86 (2019 high Mar.15) would expose $59.63 (50% Fibo of the October-December drop) and finally $61.97 (200-day SMA).
Information on these pages contains forward-looking statements that involve risks and uncertainties. Markets and instruments profiled on this page are for informational purposes only and should not in any way come across as a recommendation to buy or sell in these assets. You should do your own thorough research before making any investment decisions. FXStreet does not in any way guarantee that this information is free from mistakes, errors, or material misstatements. It also does not guarantee that this information is of a timely nature. Investing in Open Markets involves a great deal of risk, including the loss of all or a portion of your investment, as well as emotional distress. All risks, losses and costs associated with investing, including total loss of principal, are your responsibility. The views and opinions expressed in this article are those of the authors and do not necessarily reflect the official policy or position of FXStreet nor its advertisers.