WTI finds support in the $58.00 handle
|- Prices of WTI remains on the defensive albeit off lows.
- Global slowdown keeps weighing on crude oil.
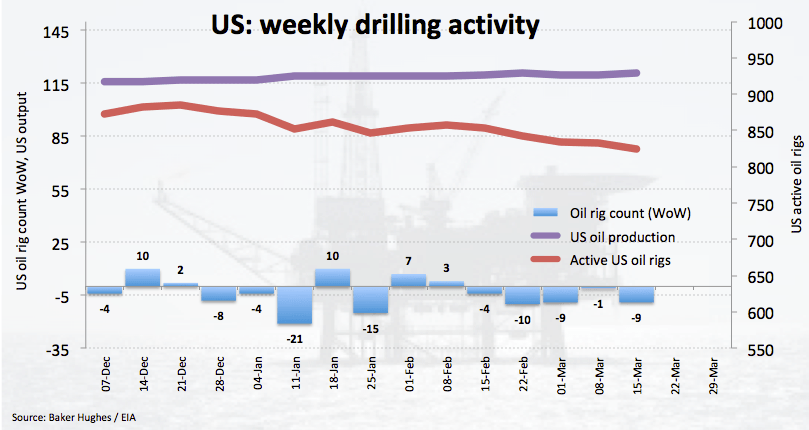
- US oil rig count dropped by 9 during last week.
Prices of the barrel of the American benchmark for the sweet light crude oil are extending the leg lower although finding quite strong contention in the $58.00 region.
WTI weaker on growth fears
The barrel of WTI keeps correcting lower on the back of persistent concerns over a global slowdown and its impact on the demand for crude oil and with China, the EU and the US in the centre of the debate.
In this regard, latest PMIs figures in Euroland and the US point to some weakness in these economies, which have also added to the view of a slow pace of growth in the Chinese economy. In addition, declining US yields and the inversion of the curve also collaborates with the sour sentiment.
Somewhat supporting prices, driller Baker Hughes reported its fifth consecutive weekly drop in oil rig count, taking US active oil rigs to 824 (from 873 seen at the beginning of the year).
Later in the week, markets’ focus will be on the usual reports by the API (Tuesday) and the EIA (Wednesday) on crude oil inventories.
What to look for around WTI
Crude oil has managed to retake the critical $60.00 mark per barrel on Thursday before sparking a correction lower. In spite of the ongoing correction in prices, the bullish view in crude oil remains well in place, always propped up by the so-called ‘Saudi put’, tight conditions in the US markets (amidst US net imports in historic low levels and the rising activity in refiners ahead of the summer session), the current OPEC+ agreement to cut oil output and ongoing US sanctions against Iranian and Venezuelan crude oil exports. Furthermore, the OPEC+ could announce an extension of the current agreement to curb oil production at the cartel’s meeting in June.
WTI significant levels
At the moment the barrel of WTI is losing 0.20% at $58.55 and faces immediate contention at $57.98 (low Mar.22) seconded by $57.31 (21-day SMA) and finally $54.37 (low Mar.8). On the other hand, a breakout of $60.03 (2019 high Mar.21) would open the door for $61.76 (200-day SMA) and then $63.74 (61.8% Fibo of the October-December drop).
Information on these pages contains forward-looking statements that involve risks and uncertainties. Markets and instruments profiled on this page are for informational purposes only and should not in any way come across as a recommendation to buy or sell in these assets. You should do your own thorough research before making any investment decisions. FXStreet does not in any way guarantee that this information is free from mistakes, errors, or material misstatements. It also does not guarantee that this information is of a timely nature. Investing in Open Markets involves a great deal of risk, including the loss of all or a portion of your investment, as well as emotional distress. All risks, losses and costs associated with investing, including total loss of principal, are your responsibility. The views and opinions expressed in this article are those of the authors and do not necessarily reflect the official policy or position of FXStreet nor its advertisers.