US Dollar Index tumbles to lows near 96.30
|- The index drops further and tests daily lows near 96.30.
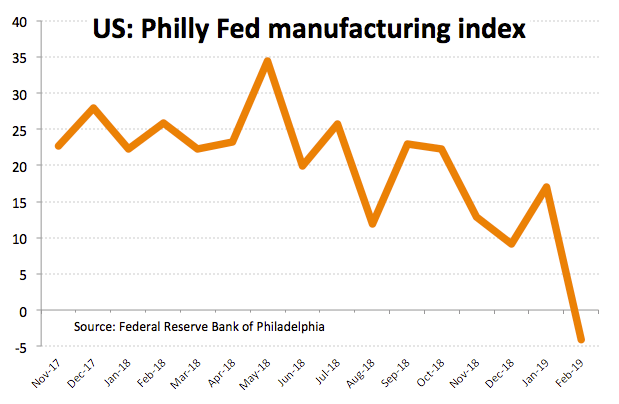
- Philly Fed index came in below expectations in February.
- Progress in US-China trade talks supports sentiment.
The greenback has reverted the initial optimism and is now trading back into the negative ground, forcing the US Dollar Index (DXY) to drop to the 96.30 region, or daily lows.
US Dollar Index weaker on trade, data, Fedspeak
A lot of bad news around the buck keeps the index depressed so far today. In the data space, the always-critical Philly Fed index tumbled to -4.1 for the current month, missing estimates. Further US data saw Durable Goods Orders expanding at a monthly 1.2% in December and Initial Claims rising by 216K WoW during last week.
Furthermore, US Secretary of State M.Pompeo said earlier that ongoing US-China trade negotiations have yielded real progress so far.
Fanning the flames around the greenback, Atlanta Fed R.Bostic (non-voter, dovish) noted the Fed’s rates are closer to neutral levels, while St. Louis Fed J.Bullard (voter, dovish) said he was against a rate hike in December, adding that rates are ‘a bit tight’ right now, while any decision on the balance sheet is expected in the next couple of meetings.
What to look for around USD
The FOMC minutes were not as dovish as expected. In fact, the Committee signalled the recent shift in the Fed’s stance was not associated to weakness in the economy but to rising uncertainty in the global markets. Despite the low inflation was back on the debate, the Fed did not rule out further hikes later in the year, although a move on rates remains highly data dependent. On another front, the US-Sino trade talks remain the almost exclusive driver for the markets’ mood in the near term. Furthermore, the deterioration in overseas fundamentals in combination with ‘softer’ stance in G10 central banks should keep occasional dips in the buck somewhat shallow.
US Dollar Index relevant levels
At the moment, the pair is receding 0.15% at 96.37 and a breach of 96.29 (low Feb.20) will target 96.22 (38.2% Fibo of the September-December up move) en route to 95.58 (200-day SMA). On the upside, the next hurdle lines up at 97.37 (2019 high Feb.15) seconded by 97.71 (2018 high Dec.14) and then 97.87 (monthly high Jun.20 2017).
Information on these pages contains forward-looking statements that involve risks and uncertainties. Markets and instruments profiled on this page are for informational purposes only and should not in any way come across as a recommendation to buy or sell in these assets. You should do your own thorough research before making any investment decisions. FXStreet does not in any way guarantee that this information is free from mistakes, errors, or material misstatements. It also does not guarantee that this information is of a timely nature. Investing in Open Markets involves a great deal of risk, including the loss of all or a portion of your investment, as well as emotional distress. All risks, losses and costs associated with investing, including total loss of principal, are your responsibility. The views and opinions expressed in this article are those of the authors and do not necessarily reflect the official policy or position of FXStreet nor its advertisers.