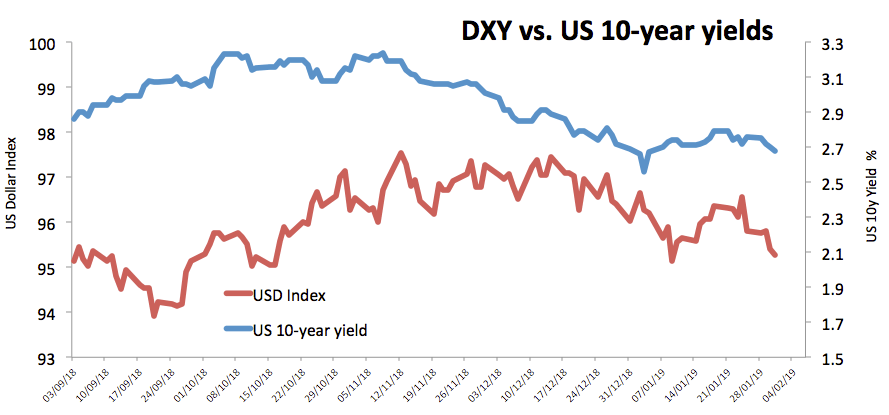
US Dollar Index slowly inching higher, around 95.30
|- The index recovers some ground lost post-FOMC on Wednesday.
- Yields of the US 10-year note remain depressed below 2.68%.
- Markets perceive the Fed’s tightening cycle could be over.
The greenback is looking to extend the rebound from post-FOMC lows and has now managed to regain the 95.30 zone when tracked by the US Dollar Index (DXY).
US Dollar Index weaker on dovish Fed
The index has once again suffered the ‘Powell Put’ on Wednesday after the FOMC now shifted to a more neutral stance in its tightening cycle, particularly regarding future rate hikes (or cuts?). In fact, and as per the FOMC’s statement, the door is now open for rates to go up or down.
When considering the next steps in determining policies, the Committee will also pay attention to developments overseas, with special interest in the slowdown in China and Europe as well as the uncertain scenario surrounding Brexit and the US-China trade negotiations.
Today’s US calendar appears pretty busy and includes the publication of Challenger Job Cuts, inflation figures gauged by the Core PCE, Initial Claims, the Employment Cost Index in Q4, New Home Sales and Personal Spending/Income.
What to look for around USD
The picture around the greenback has deteriorated further following yesterday’s FOMC meeting. It is thus expected that the index will now remain under extra pressure in the months to come amidst a renewed neutral stance by the Fed, while the Committee did not give any hints on the potential timing for the end of the balance sheet run-off, although it is seen ending sooner than market are forecasting. On another front, headlines from the US-China trade talks ending today could bring in some fresh volatility to the buck’s price action.
US Dollar Index relevant levels
At the moment, the pair is losing 0.10% at 95.31 and a breakdown of 95.16 (low Jan.31) would aim for 95.03 (2019 low Jan.10) and then 94.79 (monthly low Oct.16 2018). On the other hand, immediate resistance emerges at 95.90 (21-day SMA) seconded by 96.13 (100-day SMA) and finally 96.22 (38.2% Fibo of the September-December up move).
Information on these pages contains forward-looking statements that involve risks and uncertainties. Markets and instruments profiled on this page are for informational purposes only and should not in any way come across as a recommendation to buy or sell in these assets. You should do your own thorough research before making any investment decisions. FXStreet does not in any way guarantee that this information is free from mistakes, errors, or material misstatements. It also does not guarantee that this information is of a timely nature. Investing in Open Markets involves a great deal of risk, including the loss of all or a portion of your investment, as well as emotional distress. All risks, losses and costs associated with investing, including total loss of principal, are your responsibility. The views and opinions expressed in this article are those of the authors and do not necessarily reflect the official policy or position of FXStreet nor its advertisers.