US Dollar Index remains flat near 98.00 ahead of key data
|- DXY clinched YTD peaks at 98.00 on Monday.
- Chinese coronavirus remains in centre stage.
- Consumer Confidence, Durable Goods Orders next on tap.
The US Dollar Index (DXY), which gauges the greenback vs. a basket of its main competitors, is looking for direction in the vicinity of yearly highs around 98.00.
US Dollar Index focused on data, China
The index is navigating the upper end of the weekly range following Monday’s 2020 highs in the 98.00 neighbourhood.
In the meantime, inflows into the safe haven universe have been gathering traction in past days as the impact on global growth from the Wuhan coronavirus continues to drag on investors’ sentiment.
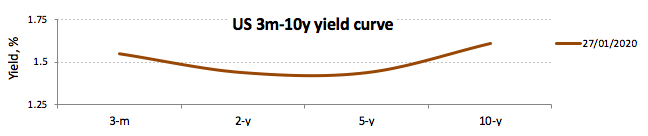
In fact, the demand for safer assets have dragged yields of the US 10-year note to levels last seen in October around 1.60%, inverting at the same time the 2y-10-y yield curve for the first time since December, while the 3m-10-y yield curve flattened to around 6 bps.
Later in the US docket, the Conference Board’s Consumer Sentiment should grab all the attention seconded by December’s Durable Goods Orders and house prices measured by the S&P/Case-Shiller Index.
What to look for around USD
DXY extended the recent breakout of the key 200-day SMA to the 98.00 mark, recording at the same time fresh yearly tops. In the meantime, headlines from the Chinese coronavirus remain in centre stage and are expected to keep dictating the price action in the global markets for the time being. On another scenario, the index keeps the positive view above the 200-day SMA, always supported by the current ‘wait-and-see’ stance from the Fed vs. the broad-based dovish view from its G10 peers, the dollar’s safe haven appeal and its status of ‘global reserve currency’. Later in the week, the FOMC event (Wednesday) and key US data releases should keep the dollar under the microscope.
US Dollar Index relevant levels
At the moment, the index is losing 0.01% at 97.93 and is expected to meet the next support at 97.71 (200-day SMA) seconded by 97.54 (55-day SMA) and then 97.09 (weekly low Jan.16). On the flip side, a break above 98.00 (2020 high Jan.27) would aim for 98.54 (monthly high Nov.29 2019) and finally 98.93 (high Aug.1 2019).
Information on these pages contains forward-looking statements that involve risks and uncertainties. Markets and instruments profiled on this page are for informational purposes only and should not in any way come across as a recommendation to buy or sell in these assets. You should do your own thorough research before making any investment decisions. FXStreet does not in any way guarantee that this information is free from mistakes, errors, or material misstatements. It also does not guarantee that this information is of a timely nature. Investing in Open Markets involves a great deal of risk, including the loss of all or a portion of your investment, as well as emotional distress. All risks, losses and costs associated with investing, including total loss of principal, are your responsibility. The views and opinions expressed in this article are those of the authors and do not necessarily reflect the official policy or position of FXStreet nor its advertisers.