US Dollar Index pushes higher, 97.00 is just around the corner
|- The index climbs near the 97.00 handle post-CPi.
- Yields of the US 10-year note print tops around 2.70%.
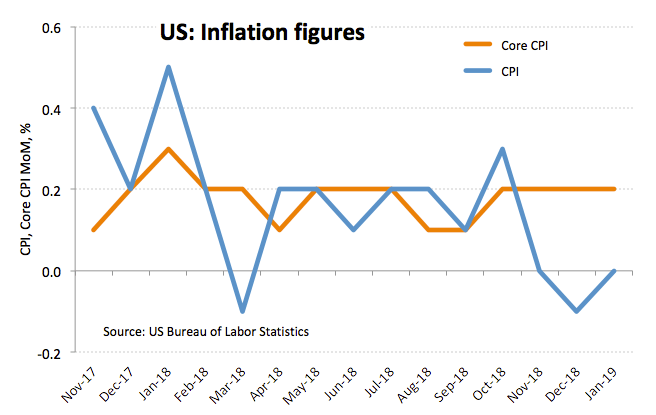
- US Core CPI surprised to the upside in January.
The greenback, in terms of the US Dollar Index (DXY), has regained the upside momentum and is now approaching the critical 97.00 handle.
US Dollar Index bid on data, yields
The index has reverted the initial pessimism and is now back to the positive territory near 97.00 the figure following auspicious results from US inflation figures, higher yields in the US money markets and recent comments noting the final word on the US-China trade talks hinges on an eventual Trump-Xi meeting.
In fact, headline CPI came in flat on a monthly basis during the first month of the year and rose at an annualized 1.6%. Further data saw Core prices rising 0.2% inter-month and 2.2% from a year earlier.
The rebound in DXY has been so far in tandem with the uptick in yields of the US 10-year note to daily tops beyond 2.70%.
Further news around the buck noted Cleveland Fed L.Mester said the Fed is now in a ‘wait and see’ mode, adding that the economy is expected to have a solid performance this year, despite a projected slower pace of growth.
What to look for around USD
Alternating news and rumours on the US-China trade talks remain poised to add volatility both to the greenback and riskier assets in the very near term. However, weakness in overseas economies (vs. solid US fundamentals) plus G10 central banks re-shifting to a neutral/dovish stance have been sustaining the upbeat momentum in the greenback since the start of February, while scepticism over a potential halt in the Fed’s tightening cycle remains on the rise and is also lending extra legs to the index.
US Dollar Index relevant levels
At the moment, the pair is advancing 0.30% at 96.99 and a break above 97.20 (2019 high Feb.12) would aim for 97.71 (2018 high Dec.14) and finally 97.87 (monthly high Jun.20 2017). On the downside, the initial support aligns at 96.41 (55-day SMA) followed by 96.22 (38.2% Fibo of the September-December up move) and then 96.18 (21-day SMA).
Information on these pages contains forward-looking statements that involve risks and uncertainties. Markets and instruments profiled on this page are for informational purposes only and should not in any way come across as a recommendation to buy or sell in these assets. You should do your own thorough research before making any investment decisions. FXStreet does not in any way guarantee that this information is free from mistakes, errors, or material misstatements. It also does not guarantee that this information is of a timely nature. Investing in Open Markets involves a great deal of risk, including the loss of all or a portion of your investment, as well as emotional distress. All risks, losses and costs associated with investing, including total loss of principal, are your responsibility. The views and opinions expressed in this article are those of the authors and do not necessarily reflect the official policy or position of FXStreet nor its advertisers.