US Dollar Index in new 4-month tops near 99.50
|- DXY pushes higher and clinches new yearly highs near 99.50.
- Renewed concerns around the Chinese coronavirus support the dollar.
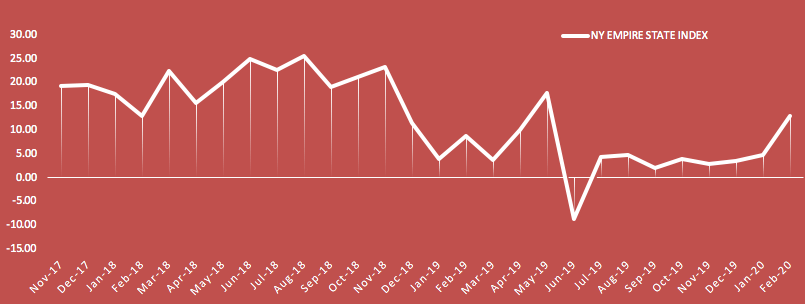
- NY Empire State index came in above expectations in February.
The US Dollar Index (DXY), which tracks the greenback vs. a basket of its main competitors, is trading on a firmer footing and printing new peaks in the mid-99.00s on Tuesday.
US Dollar Index stronger on risk-off mood, EUR-selling
The index has picked up extra pace in the first half of the week and printed new highs in the vicinity of 99.50, levels last seen in October 2019. The rally in the buck thus remains unaltered despite current overbought levels (RSI around 75.0) and after posting gains in ten out of the last twelve sessions (up more than 2% in February).
Positive results from the US fundamentals, renewed risk-off sentiment on the back of the fast-spreading COVID-19 in China and, mainly, the exacerbated weakness around the euro have all been sustaining the sharp advance of DXY so far this month.
On Tuesday’s docket, the NY Empire State manufacturing index surprised to the upside in February, improving to 12.9 from January’s 4.80 and forecasts at 5.00. Later in the NA session, the NAHB index is due along with December’s TIC Flows.
What to look for around USD
The index has extended the march north to new 2020 highs near 99.50 on Tuesday, keeping the bid bias unaltered for the time being. Investors are expected to keep looking to the performance of US fundamentals and the broader risk appetite trends for direction as well as any fresh developments from the COVID-19. In the meantime, the outlook on the dollar remains constructive and bolstered by the current “appropriate” monetary stance from the Fed vs. the broad-based dovish view from its G10 peers, the “good shape” of the domestic economy, the buck’s safe haven appeal and its status of “global reserve currency”.
US Dollar Index relevant levels
At the moment, the index is gaining 0.25% at 99.39 and a breakout of 99.47 (2020 high Feb.18) would aim for 99.67 (2019 high Oct.1) and finally 100.00 (psychological barrier). On the flip side, immediate contention emerges at 98.80 (23.6% Fibo retracement of the February rally) seconded by 98.54 (monthly high Nov.29 2019) and then 98.30 (21-day SMA).
Information on these pages contains forward-looking statements that involve risks and uncertainties. Markets and instruments profiled on this page are for informational purposes only and should not in any way come across as a recommendation to buy or sell in these assets. You should do your own thorough research before making any investment decisions. FXStreet does not in any way guarantee that this information is free from mistakes, errors, or material misstatements. It also does not guarantee that this information is of a timely nature. Investing in Open Markets involves a great deal of risk, including the loss of all or a portion of your investment, as well as emotional distress. All risks, losses and costs associated with investing, including total loss of principal, are your responsibility. The views and opinions expressed in this article are those of the authors and do not necessarily reflect the official policy or position of FXStreet nor its advertisers.