US Dollar Index challenges daily lows near 99.00, U-Mich in sight
|- DXY comes under pressure near the 99.00 mark.
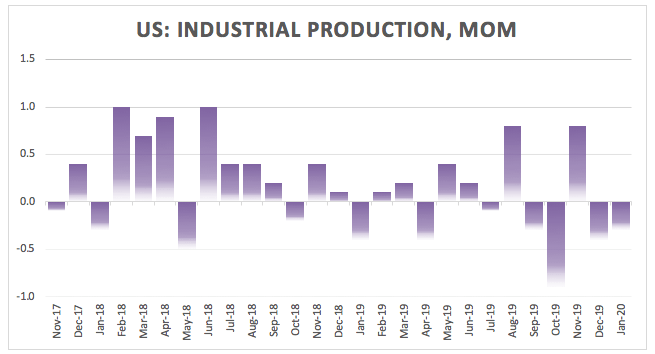
- US Industrial Production contracted more than expected.
- US flash February U-Mich index next of relevance in the docket.
The US Dollar Index (DXY), which tracks the buck vs a bundle of its main competitors, remains on the defensive at the end of the week and is now flirting with the 99.00 mark.
US Dollar Index offered on poor data
The index is losing further momentum on Friday and it has accelerated the correction lower from earlier YTD tops after Retail Sales failed to surprise markets to the upside, while Industrial Production unexpectedly contracted more than predicted in January.
Despite the current knee-jerk, the dollar remains well on track to close the second consecutive week with gains, including new YTD highs beyond 99.00 the figure and trading in levels last seen in October 2019.
Closing the weekly docket, the advanced gauge of the Consumer Sentiment measured by the U-Mich index is coming up next ahead of the weekly report on US drilling activity by Baker Hughes.
What to look for around USD
The index extended the rally to the area above the 99.00 mark, clinching at the same time new 2020 tops. Following a neutral/dovish message from the FOMC at its latest meeting, the upbeat assessment of the economy and a resilient financial system confirmed by the Fed’s semi-annual Monetary Policy Report published last week and “no news” from Powell’s testimonies this week, investors should now keep looking to the performance of US fundamentals and the broader risk appetite trends for direction as well as any fresh developments from the COVID-19. In the meantime, the outlook on the buck remains constructive and propped up by the current ‘wait-and-see’ stance from the Fed vs. the broad-based dovish view from its G10 peers, the ‘good shape’ of the domestic economy, the dollar’s safe haven appeal and its status of ‘global reserve currency’.
US Dollar Index relevant levels
At the moment, the index is losing 0.10% at 99.00 and faces the next support at 98.54 (monthly high Nov.29 2019) seconded by 98.15 (21-day SMA) and then 97.76 (200-day SMA). On the upside, a break above 99.16 (2020 high Feb.14) would aim for 99.37 (high Sep.3 2019) and finally 99.67 (2019 high Oct.1).
Information on these pages contains forward-looking statements that involve risks and uncertainties. Markets and instruments profiled on this page are for informational purposes only and should not in any way come across as a recommendation to buy or sell in these assets. You should do your own thorough research before making any investment decisions. FXStreet does not in any way guarantee that this information is free from mistakes, errors, or material misstatements. It also does not guarantee that this information is of a timely nature. Investing in Open Markets involves a great deal of risk, including the loss of all or a portion of your investment, as well as emotional distress. All risks, losses and costs associated with investing, including total loss of principal, are your responsibility. The views and opinions expressed in this article are those of the authors and do not necessarily reflect the official policy or position of FXStreet nor its advertisers.