Shiba Inu price shows long-term investors are still buying, is a market bottom near?
|- Shiba Inu price could print new yearly lows if November’s monthly candlestick closes below the October low at $0.00000926.
- On-chain metrics show investors who bought near all-time lows are still adding to their positions.
- A monthly close above $0.0000926 would still be bearish but creates a scenario for a liquidity hunt targeting the mid and upper bounds of November’s trading range.
Shiba Inu price has investors honing in as the monthly settlement may provide context for SHIB's future price action. The bears are clearly in control of the trend, but subtle signs of bullishness should be investigated. Due to these factors, SHIB could witness an influx of volatility in the coming days.
Shiba Inu price is worth keeping an eye on
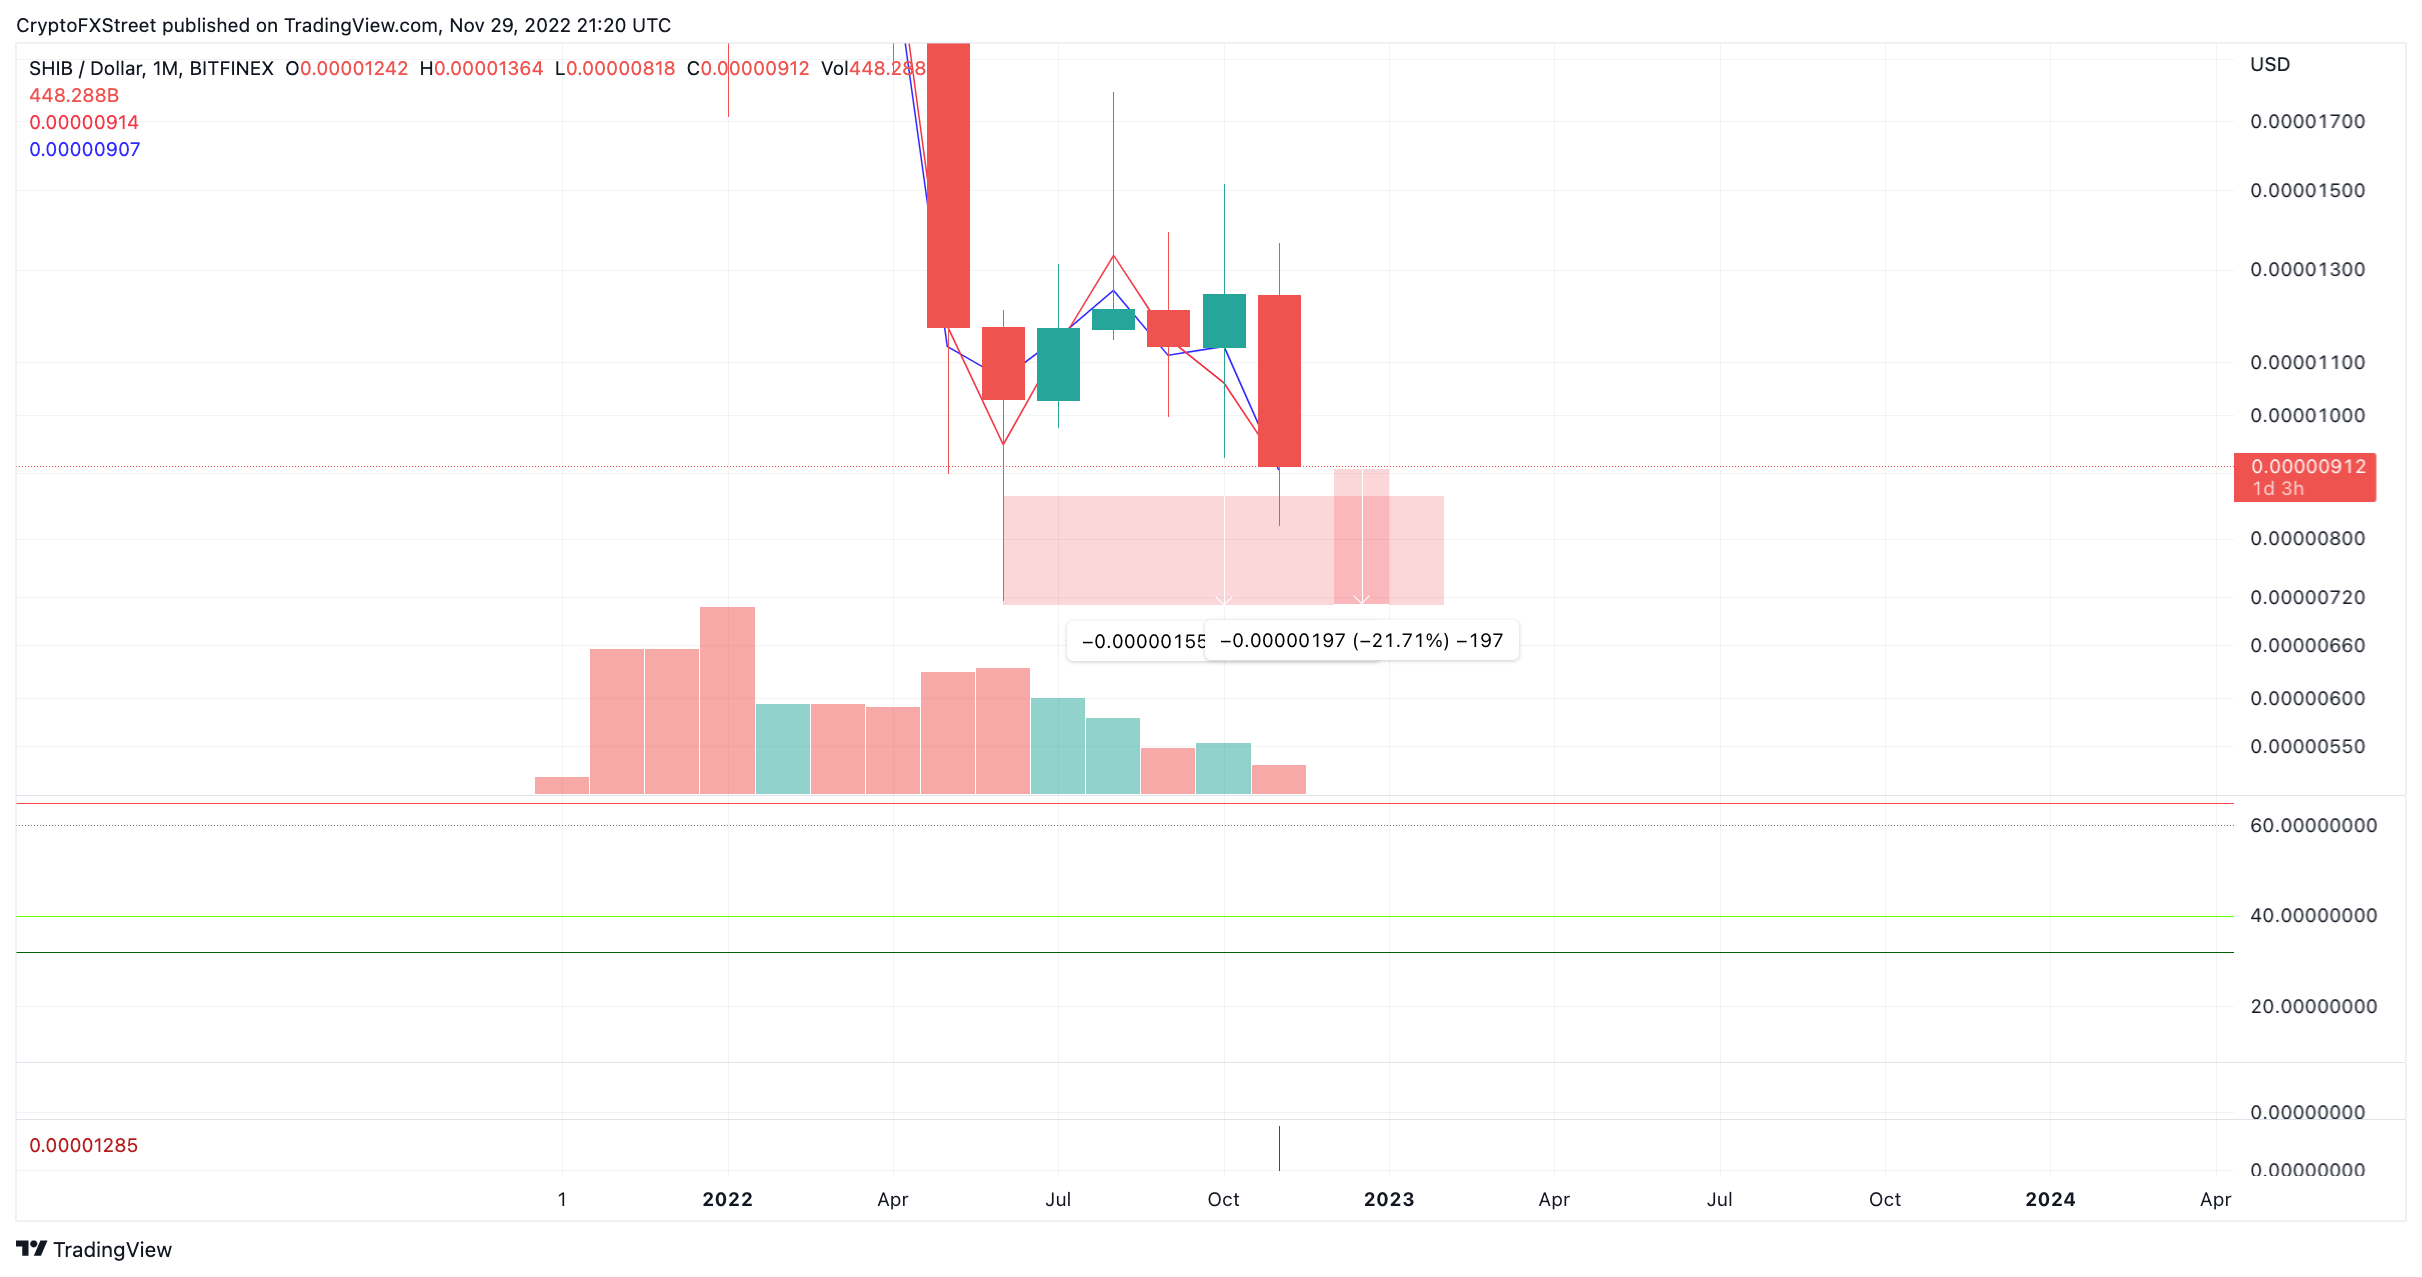
Shiba Inu price is undergoing a difficult time gaining new capital from investors. On November 29, SHIB was down 27% from the monthly open. The bears have managed to wipe liquidity underneath the October low at $0.00000926 as the price continues to consolidate below. If the bears can produce a monthly closing candlestick below the low of October, classical price action techniques could project a future rally into new all-time lows.
Shiba Inu currently trades at $0.00000008. Despite the unfortunate demise of the SHIB price, the volume indicator shows the lowest amount of transactions occurring during the year. The volume indicator is a great tool used to gauge market sentiment. In theory, fewer participants willing to sell should eventually create the supply and demand equation needed for a market reversal.
SHIB/USDT 1-month chart
Still, on-chain metrics provide some context for SHIB's long-term forecasts. Sentiment's all-time higher/lower indicator is a tool that accounts for all addresses on the blockchain that bought SHIB within 20% of the all-time lows and all-time highs. The All-Time Lowers indicator remains unfazed. Despite the severe decline in the month, nearly 37,000 addresses have continued to add to their position.
The All-Time Highers indicator remains sideways at 65,000 addresses that purchased SHIB within 20% of all-time highs. Based on previous bull runs, the indicator usually declines by 66% before a rally is triggered. Currently, the indicator is down about 45% from its recent high at 112,000 addresses who bought SHIB, within 20% of the all-time highs.
IntoTheBlock All Time Highers/Lowers indicator
Based on classical price action techniques, the bulls will need to close above the previous monthly low to invalidate the potential for a bear rally targeting $0.00000700. A monthly settle above $0.00000926 could create a chance for a hike back up to the other side of November's trading range at $0.00001240, resulting in a 35% increase from the current Shiba Inu price.
Here's how Bitcoin's moves could affect the Shiba Inu price
Information on these pages contains forward-looking statements that involve risks and uncertainties. Markets and instruments profiled on this page are for informational purposes only and should not in any way come across as a recommendation to buy or sell in these assets. You should do your own thorough research before making any investment decisions. FXStreet does not in any way guarantee that this information is free from mistakes, errors, or material misstatements. It also does not guarantee that this information is of a timely nature. Investing in Open Markets involves a great deal of risk, including the loss of all or a portion of your investment, as well as emotional distress. All risks, losses and costs associated with investing, including total loss of principal, are your responsibility. The views and opinions expressed in this article are those of the authors and do not necessarily reflect the official policy or position of FXStreet nor its advertisers.