Ethereum Price Prediction: ETH needs to hold a critical support level to avoid slipping to $370
|- Ethereum broke out of an ascending triangle pattern on October 22.
- The price has been re-testing the new support level established at $390 for three days in a row.
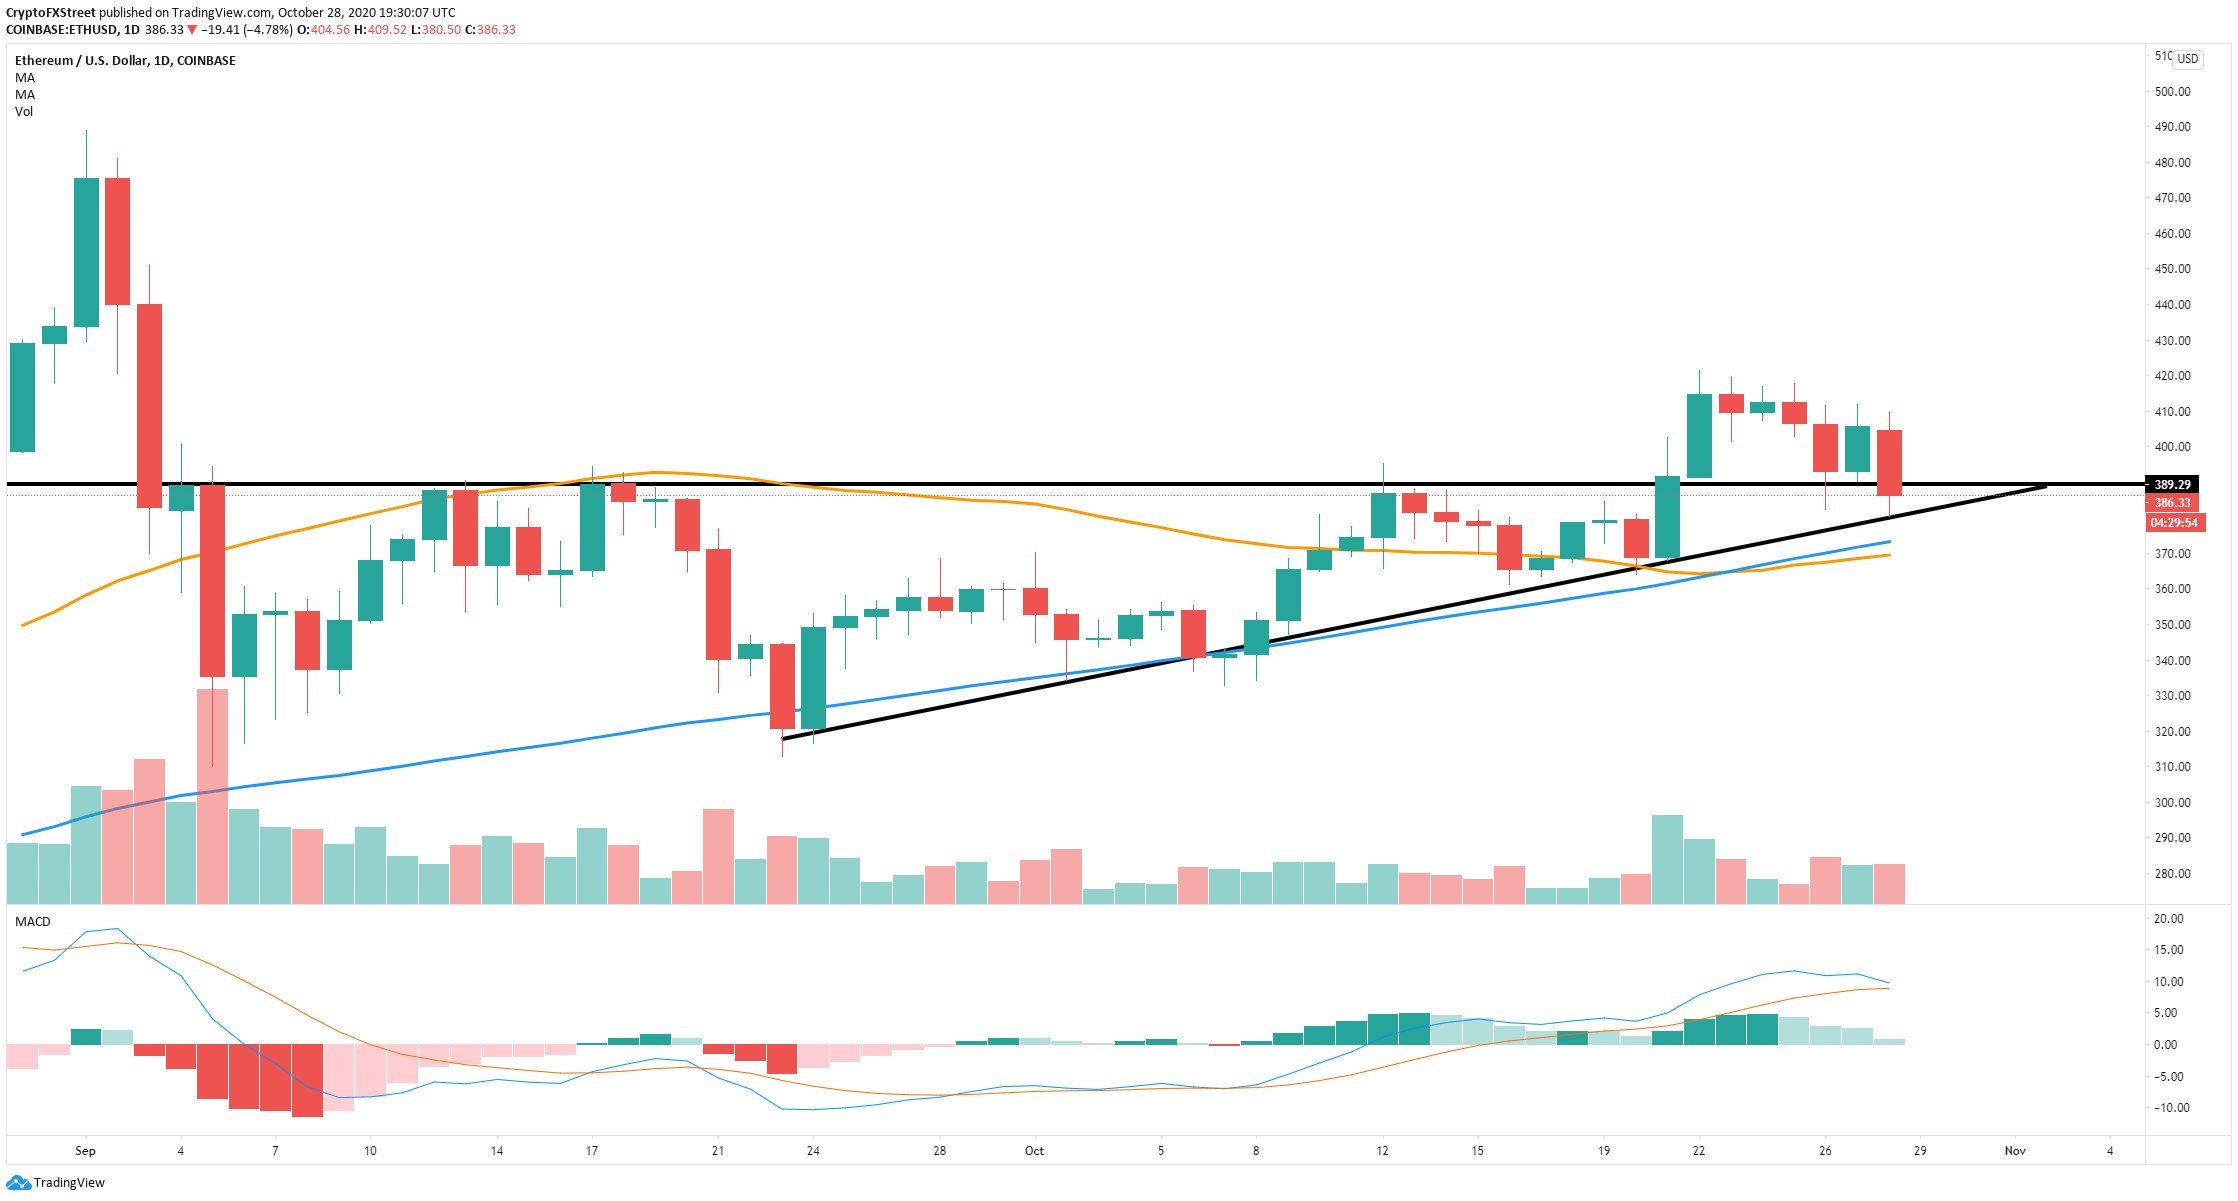
Ethereum had a massive breakout above a daily ascending triangle on October 22 jumping to $421 but getting very little continuation in the next three days. As usual with these kinds of patterns, the price started to re-test the old resistance level at $390.
Ethereum bulls must hold $390 to avoid further downside action
The previous resistance level at $390 is now acting as a support level, however, the current price of ETH is still below at $386. If bulls can’t hold this level, Ethereum is at risk of falling towards the 50-SMA and the 100-SMA on the daily chart converging at the $370 area. The MACD is also on the verge of a bear cross, for the first time since September 21.
ETH/USD daily chart
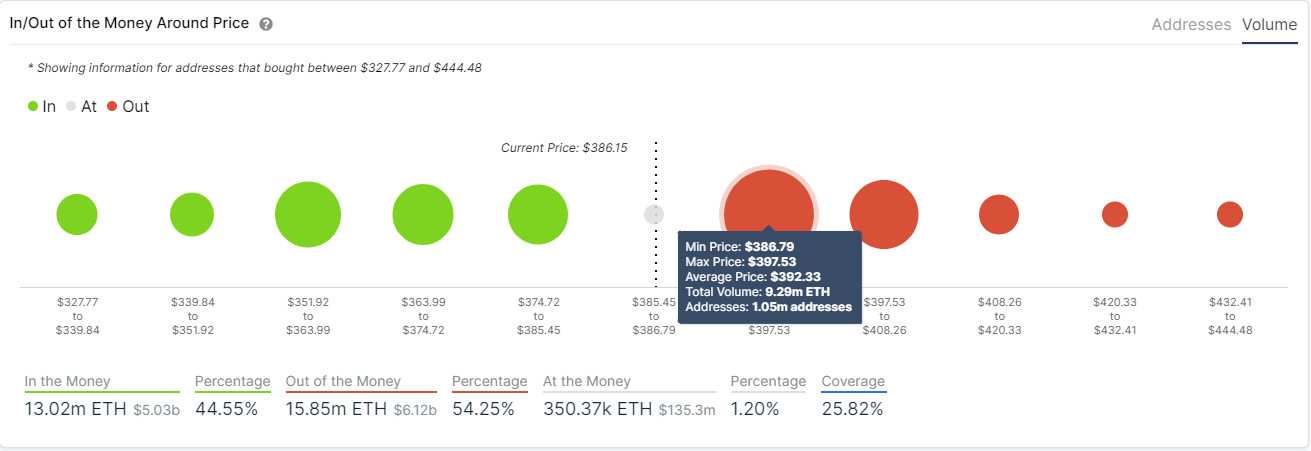
Beyond technical analysis, the In/Out of the Money Around Price (IOMAP) model shows strong resistance above between $386 and $397 but very little support on the way down, which means more coins were bought above $386, increasing the selling pressure from investors that might want to cash out at their breaking-even point.
ETH IOMAP chart
Some positive signs for Ethereum
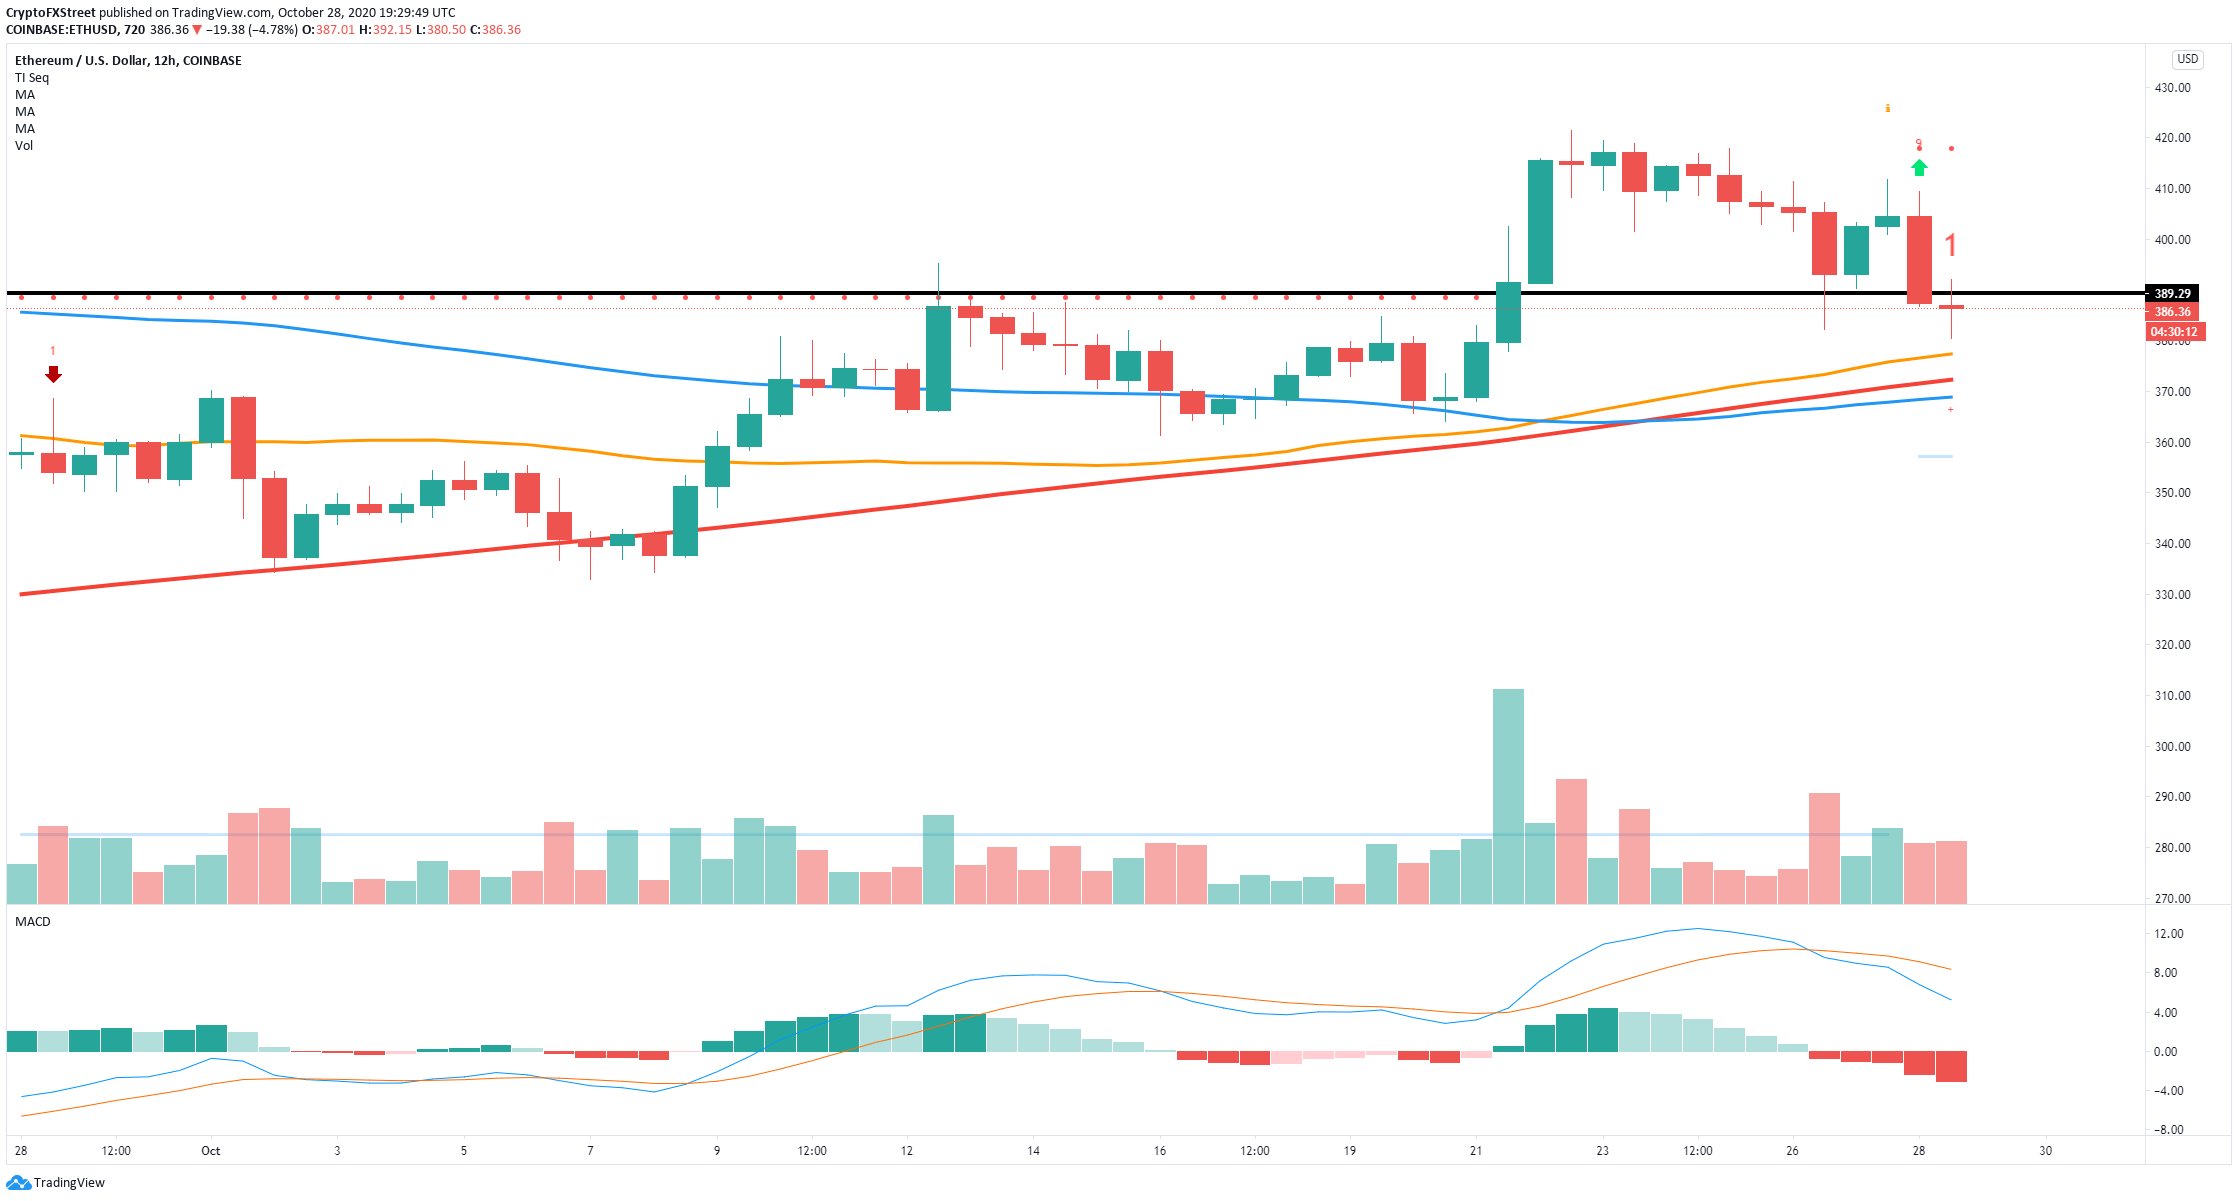
On the other hand, the TD sequential indicator has presented a buy signal, in the form of a red nine candle, on the 12-hour chart on October 28. A successful defense of the support level at $390 can drive Ethereum towards the last high at $421.
ETH/USD 12-hour chart
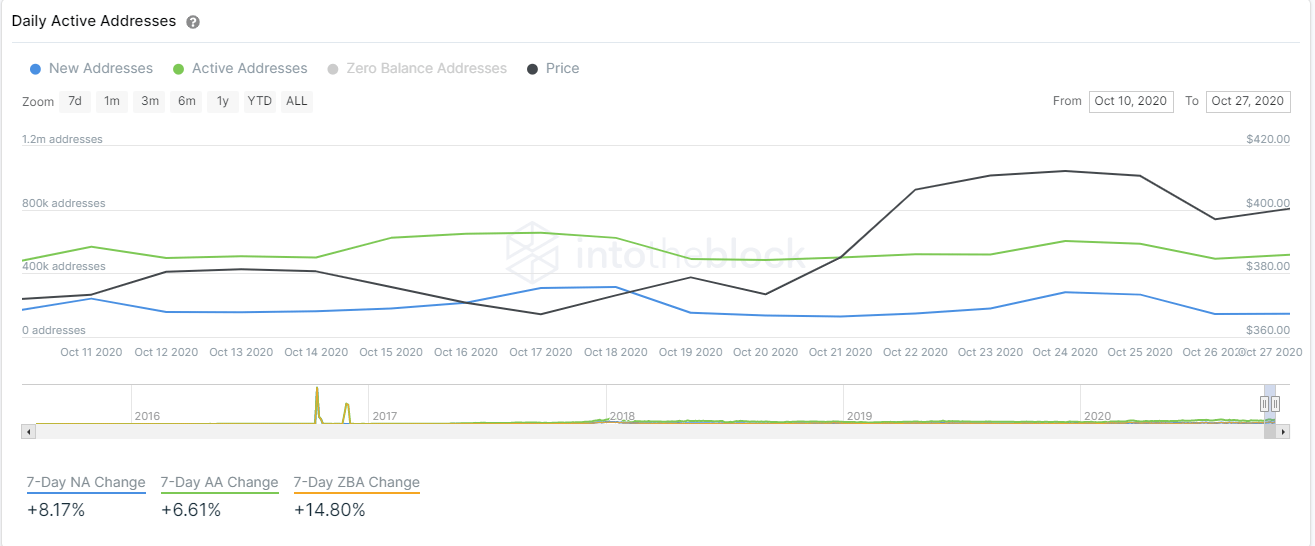
Additionally, thanks to statistics provided by IntoTheBlock, it can be observed an increase in the number of new ETH addresses joining the network, as well as, active addresses in the past seven days. This indicates, new and older investors are interested in Ethereum despite the decline in price.
ETH New and Active addresses
Information on these pages contains forward-looking statements that involve risks and uncertainties. Markets and instruments profiled on this page are for informational purposes only and should not in any way come across as a recommendation to buy or sell in these assets. You should do your own thorough research before making any investment decisions. FXStreet does not in any way guarantee that this information is free from mistakes, errors, or material misstatements. It also does not guarantee that this information is of a timely nature. Investing in Open Markets involves a great deal of risk, including the loss of all or a portion of your investment, as well as emotional distress. All risks, losses and costs associated with investing, including total loss of principal, are your responsibility. The views and opinions expressed in this article are those of the authors and do not necessarily reflect the official policy or position of FXStreet nor its advertisers.