Chainlink Price Prediction: The last time this indicator turned bullish LINK skyrocketed 300%
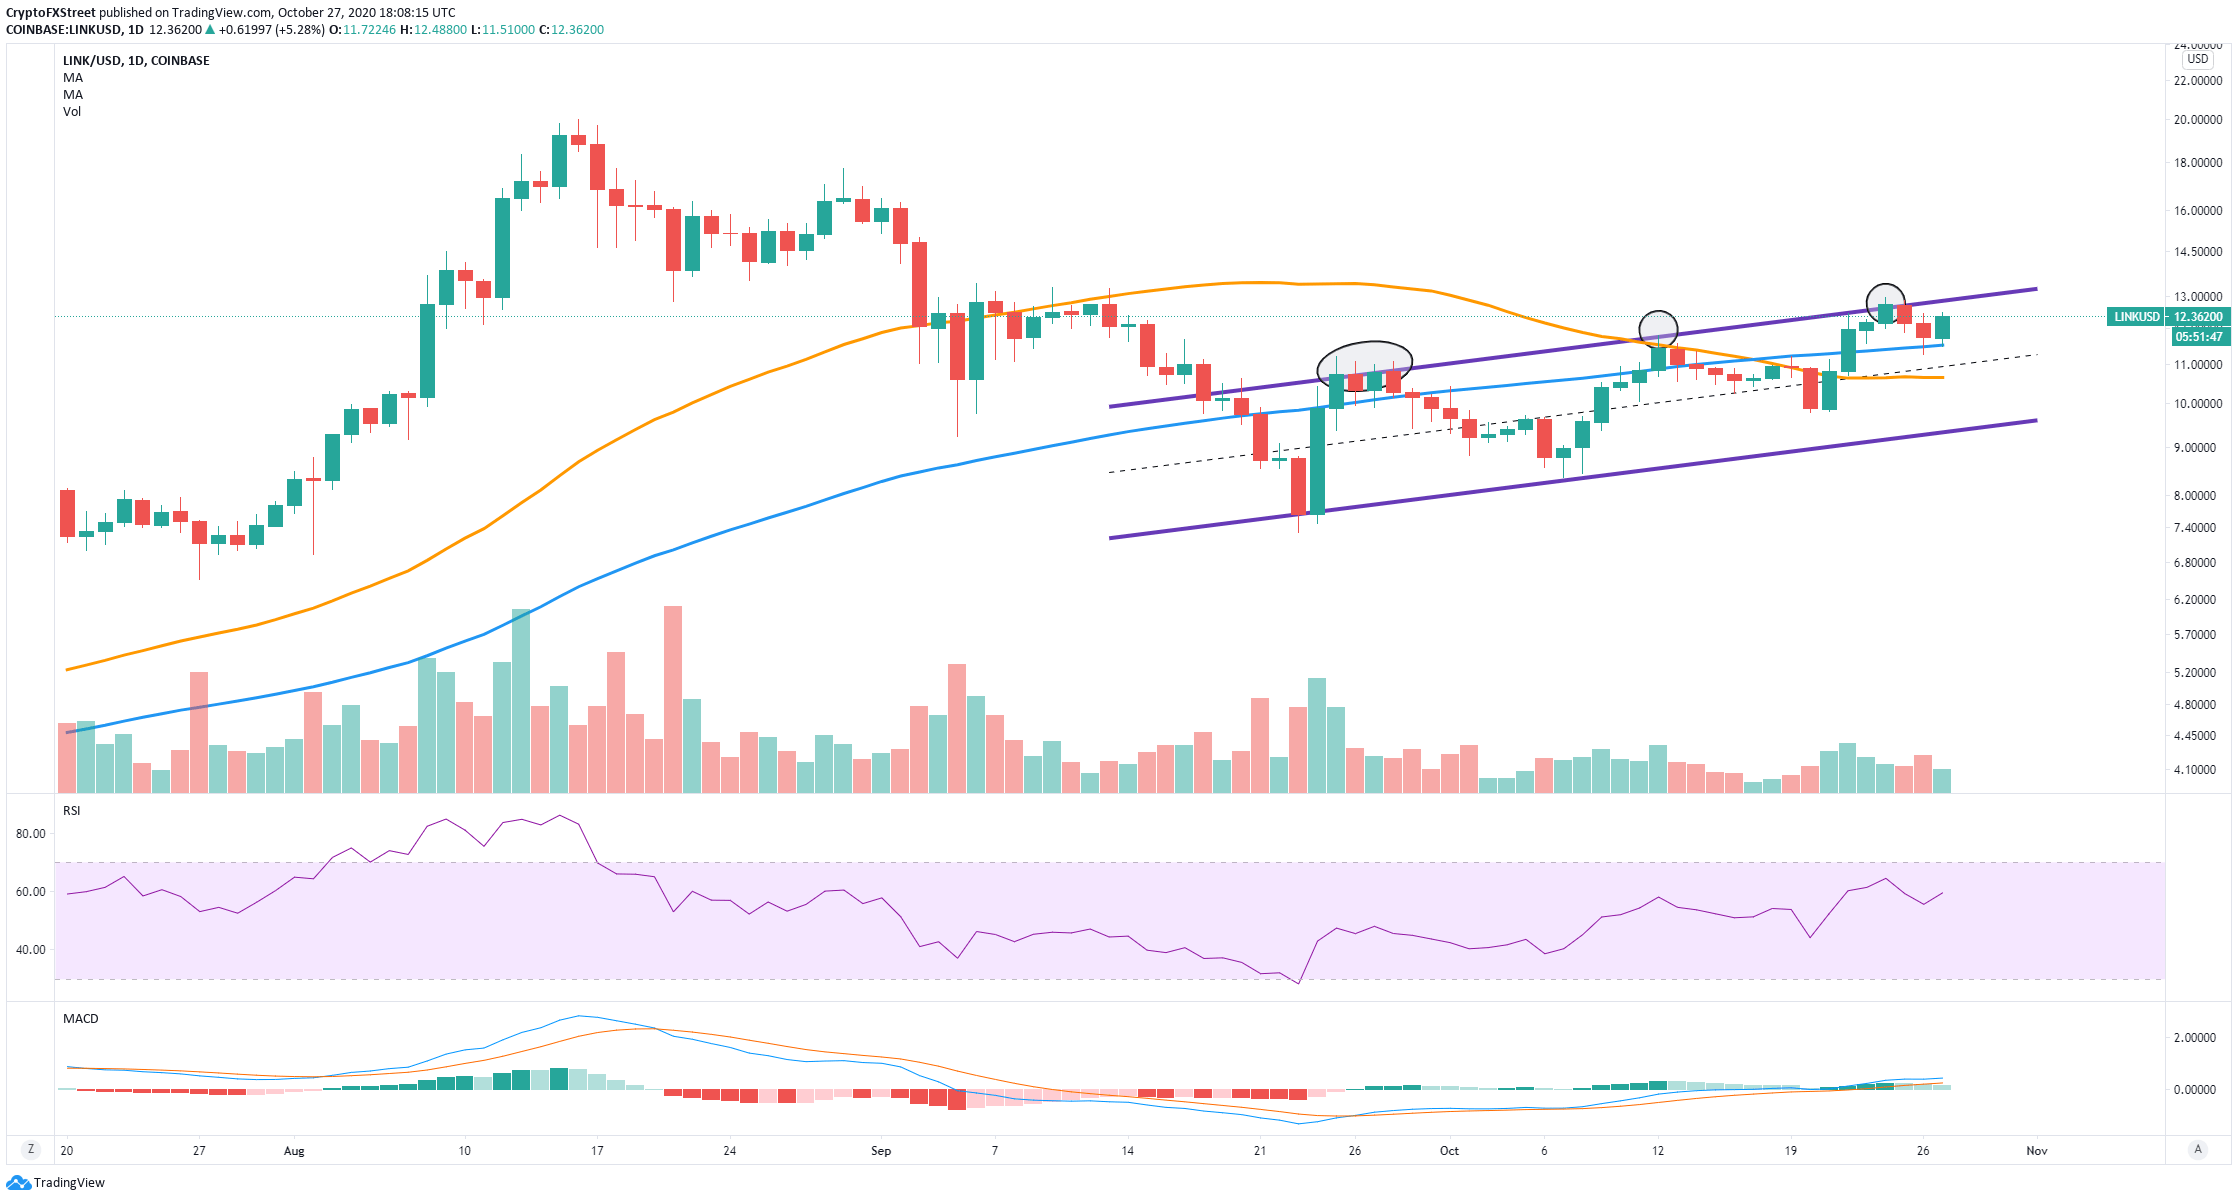
|- LINK is trading inside a daily ascending parallel channel.
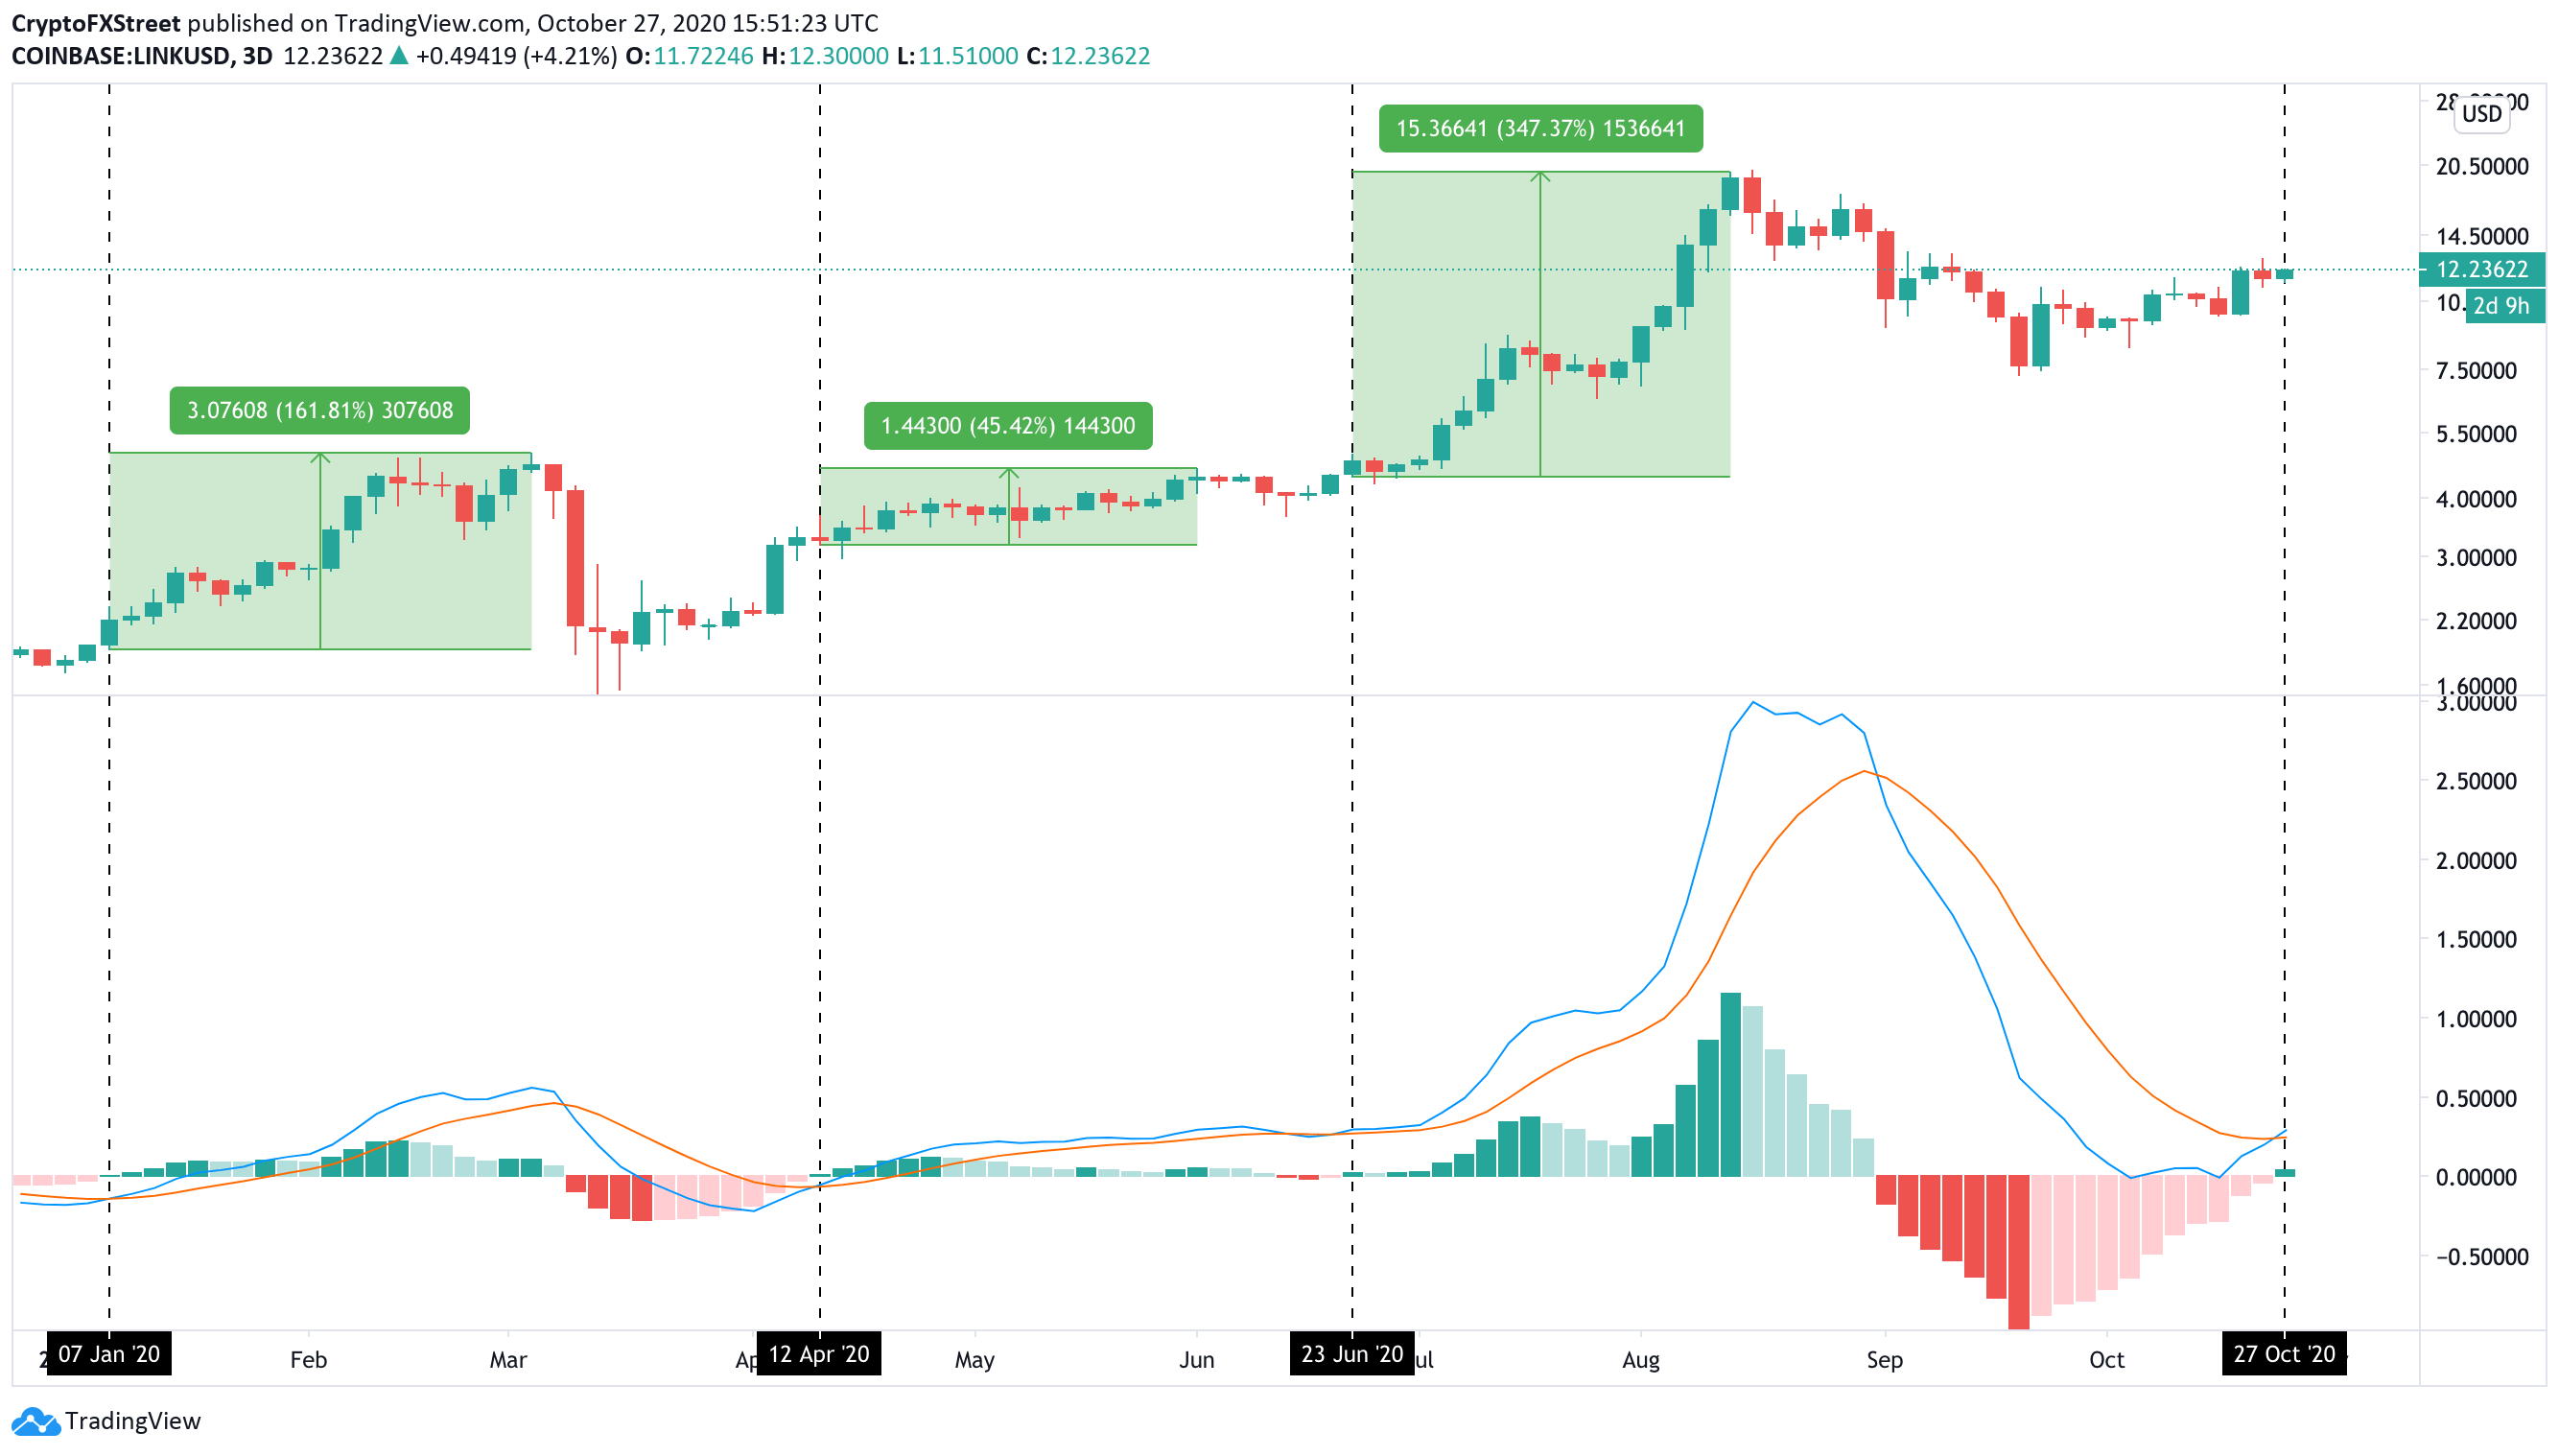
- The MACD turned bullish on the 3-day chart for the first time since September.
LINK established a bottom at $7.31 on September 23 and has rebounded strongly, reaching a peak of $12.97 just three days ago on October 24. The digital asset continues trading inside an ascending parallel channel on the daily chart, currently at 12.35.
This primary indicator shows LINK is ready for a 300% rally
The MACD has turned bullish on the 3-day chart, which hasn't happened since June 23. That last bull cross pushed the price of LINK up by 347% in the next two months. The price of Chainlink has reacted positively to MACD bullish crossovers.
LINK/USD 3-day chart
The previous two bull crosses also managed to drive the price of LINK up, although not as high as the last 347% rally. With this percentage in mind, the next bull price target would be $50, or at least the all-time high at $20.
LINK faces potential rejection at $13 from an ascending parallel channel
Despite the bullish signal presented on the 3-day chart, the digital asset remains bounded inside a daily ascending parallel channel. The upper boundary of this pattern has acted as a robust resistance level several times in the past.
LINK/USD daily chart
Rejection from the $13 resistance level can drive LINK's price down to the 100-SMA at $11.5 and even to the 50-SMA at $10.67. The absolute lowest support point is located at $9.5, the lower boundary of the pattern.
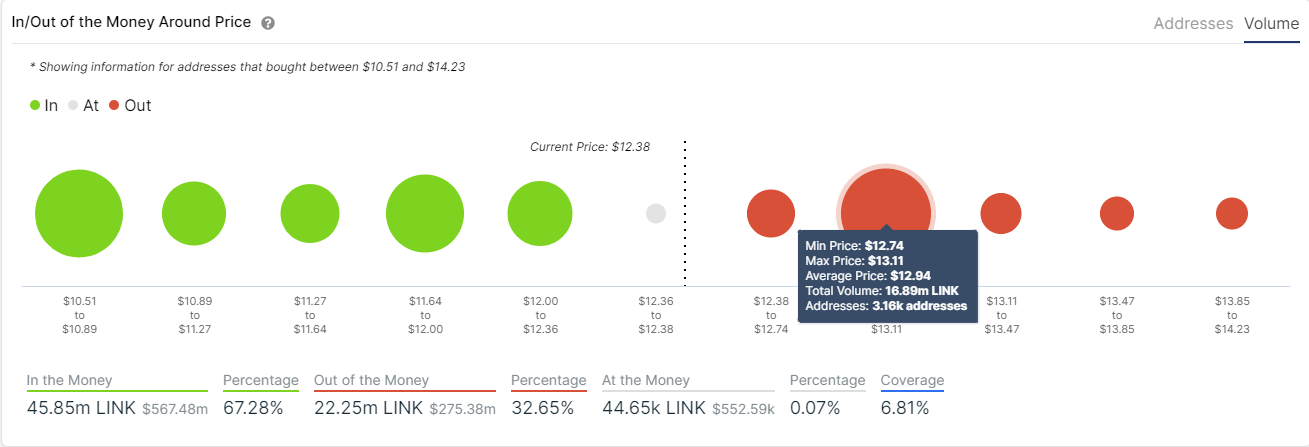
LINK IOMAP chart
The In/Out of the Money Around Price chart shows a similar picture with a substantial resistance area between $12.74 and $13.11, with around 17 million LINK in volume. This area is relatively more potent than the support below.
Information on these pages contains forward-looking statements that involve risks and uncertainties. Markets and instruments profiled on this page are for informational purposes only and should not in any way come across as a recommendation to buy or sell in these assets. You should do your own thorough research before making any investment decisions. FXStreet does not in any way guarantee that this information is free from mistakes, errors, or material misstatements. It also does not guarantee that this information is of a timely nature. Investing in Open Markets involves a great deal of risk, including the loss of all or a portion of your investment, as well as emotional distress. All risks, losses and costs associated with investing, including total loss of principal, are your responsibility. The views and opinions expressed in this article are those of the authors and do not necessarily reflect the official policy or position of FXStreet nor its advertisers.