Band Protocol Price Prediction: BAND formed a bullish reversal pattern, targeting $10
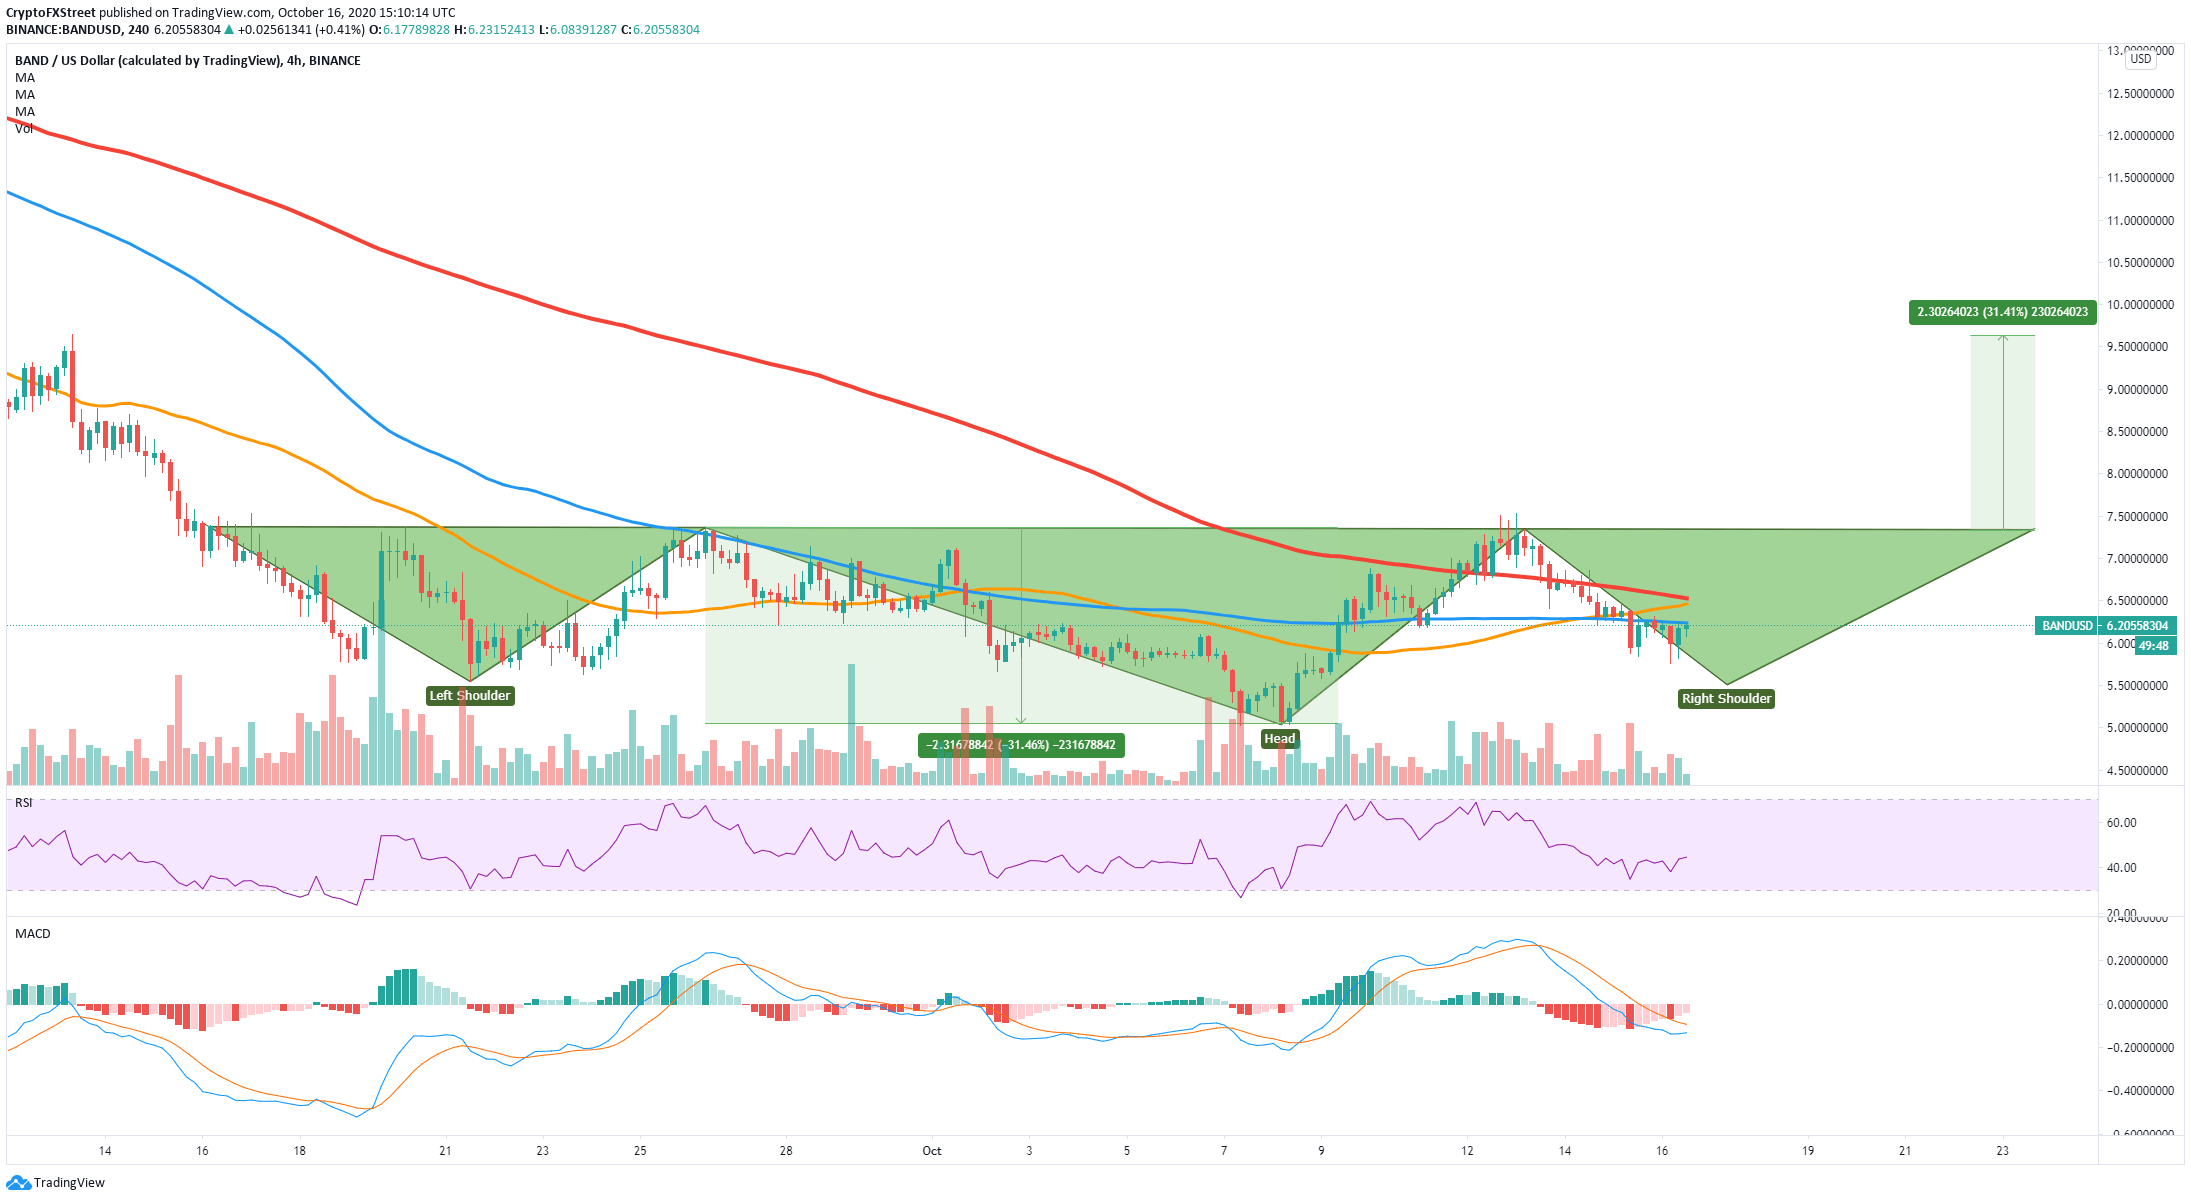
|- BAND seems to have formed an inverse head and shoulders pattern on the 4-hour chart.
- Bulls are eying up a potential price target at $10.
BAND is currently trading at $6.15, losing around 65% of its value since the peak at $17.97 on August 10. Nonetheless, the digital asset still holds a $126 million market capitalization and shows signs of a potential bullish reversal.
BAND aiming for a reversal, according to several indicators
Overall, it seems that the entire cryptocurrency market is turning bullish despite the recent FUD from various exchanges. Willy Woo, an expert in on-chain metrics, has posted a Tweet stating that the last announcement about OKEx locking withdrawals didn’t affect the market, which indicates we are in bull season.
BAND/USD 4-hour chart
It looks like BAND could be forming the right shoulder of the inverse head and shoulders pattern. The most critical resistance level is $7.33, a bullish breakout above this level can potentially drive the price towards $10, using the length of the head of the pattern.
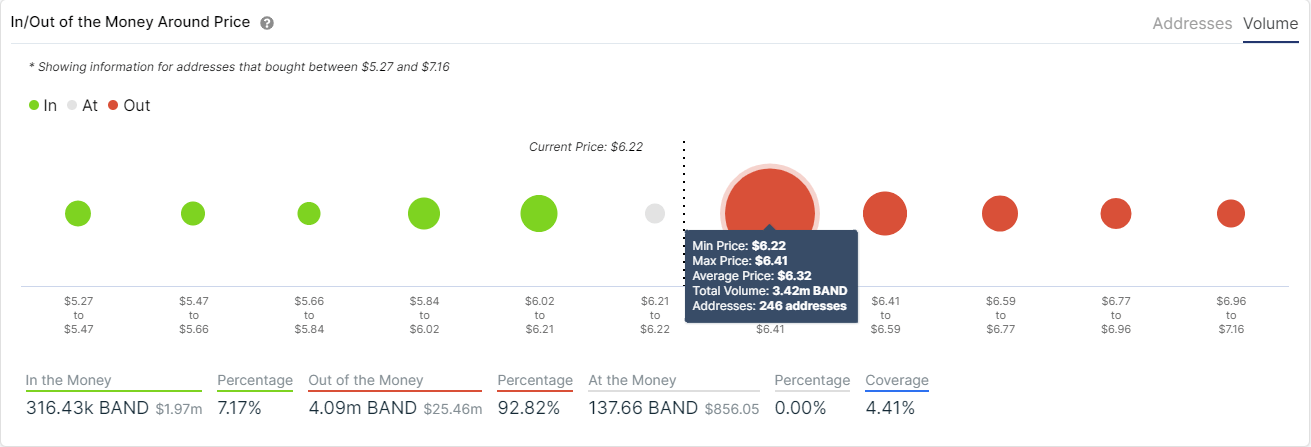
BAND IOMAP Chart
The MACD is slowly turning bullish, and the In/Out of the Money Around Price chart shows there is only one significant resistance area between $6.22 and $6.41, with 3.42 million BAND in volume. Above this point, the resistance is notably low in comparison, which means an initial breakout above $6.41 can push BAND to the $7.33 resistance.
BAND/USD 1-hour chart
-637384581111545536.png)
On the other hand, although the inverse head and shoulders pattern has potential, BAND faces several technical resistance levels. On the 1-hour chart, the 50-SMA is currently acting as a strong resistance point. The 200-SMA and the 100-SMA will also pose a threat to the bulls.
Additionally, observing the same IOMAP chart as above, we can notice a lack of support on the way down. A failure to hold the support level at $5.5 where the right shoulder is located, would most likely drive BAND towards the low of $5 and possibly even lower.
Crucial price points for investors
A bullish inverse head and shoulders pattern formed on the 4-hour chart signifies a potential reversal for BAND. A breakout above $6.41 can push BAND towards the baseline of the pattern at $7.33. Climbing above this point can lead the digital asset to $10.
Despite the bullish pattern, BAND seems to be facing several important resistance levels on the way up. A failure to hold the most critical support level established at $5.5 can easily take the digital asset down to the low of $5 and potentially even lower.
Information on these pages contains forward-looking statements that involve risks and uncertainties. Markets and instruments profiled on this page are for informational purposes only and should not in any way come across as a recommendation to buy or sell in these assets. You should do your own thorough research before making any investment decisions. FXStreet does not in any way guarantee that this information is free from mistakes, errors, or material misstatements. It also does not guarantee that this information is of a timely nature. Investing in Open Markets involves a great deal of risk, including the loss of all or a portion of your investment, as well as emotional distress. All risks, losses and costs associated with investing, including total loss of principal, are your responsibility. The views and opinions expressed in this article are those of the authors and do not necessarily reflect the official policy or position of FXStreet nor its advertisers.