USD/RUB challenges monthly lows in sub-64.00 levels
|- RUB picks up extra pace on Monday vs. the greenback.
- The pair tests the sub-64.00 region, near monthly lows.
- The barrel of Brent crude gains around 3% near the $74.00 mark.
The greenback has started the week on a defensive fashion today, helping USD/RUB to test the area of monthly lows in the 63.80 region.
USD/RUB looks to risk trends, Brent
RUB is gaining momentum today in tandem with the rebound in the sentiment surrounding the risk-associated complex.
Additionally, the Russian currency is deriving support from the rally in crude oil prices, pushing the barrel of European benchmark Brent crude to the $74.00 area, up nearly 3% for the day.
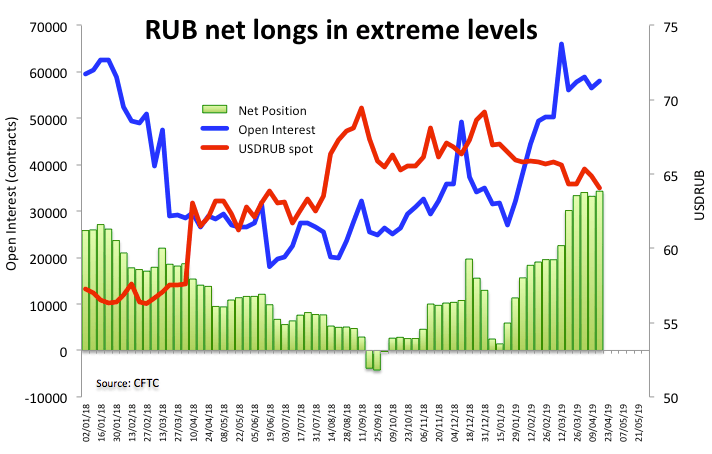
Furthermore, the pair is navigating its fourth consecutive week in the red territory and trades at shouting distance from YTD lows in the 63.60 region recorded in mid-March. Speculative positioning is also lending wings to RUB, with net longs reaching multi-year highs in recent weeks.
In the data space, Russian GDP figures released last week saw the economy expanding at an annualized 0.6% during March, the jobless rate ticking lower to 4.7% in the same period and Retail Sales gaining 1.6% on a year to March.
What to look for around RUB
The ongoing down trend in inflation plus the economy expanding above estimates could not only prevent the CBR from hiking rates further this year but it could also spark an easing cycle starting as early as this year, according to the latest statement from the central bank. In the meantime, the carry-trade remains supportive of RUB along with expected higher oil prices (despite RUB seems to have decoupled from oil dynamics as of late) and positioning. On the negative side, the spectre of further sanctions on Russian citizens or the economy as well as geopolitical jitters carries the potential to undermine occasional upside momentum in RUB.
USD/RUB levels to watch
At the moment the pair is losing 0.36% at 63.79 and a break below 63.61 (2019 low Mar.21) would aim for 62.99 (200-week SMA) and finally 62.18 (low Jul.31 2018). On the other hand, immediate hurdle aligns at 65.08 (55-day SMA) seconded by 65.84 (high Apr.1) and then 66.29 (200-day SMA).
Information on these pages contains forward-looking statements that involve risks and uncertainties. Markets and instruments profiled on this page are for informational purposes only and should not in any way come across as a recommendation to buy or sell in these assets. You should do your own thorough research before making any investment decisions. FXStreet does not in any way guarantee that this information is free from mistakes, errors, or material misstatements. It also does not guarantee that this information is of a timely nature. Investing in Open Markets involves a great deal of risk, including the loss of all or a portion of your investment, as well as emotional distress. All risks, losses and costs associated with investing, including total loss of principal, are your responsibility. The views and opinions expressed in this article are those of the authors and do not necessarily reflect the official policy or position of FXStreet nor its advertisers.