USD/CAD dips to 2-day lows near 1.3230
|- Spot loses traction and retreats to the 1.3230 region.
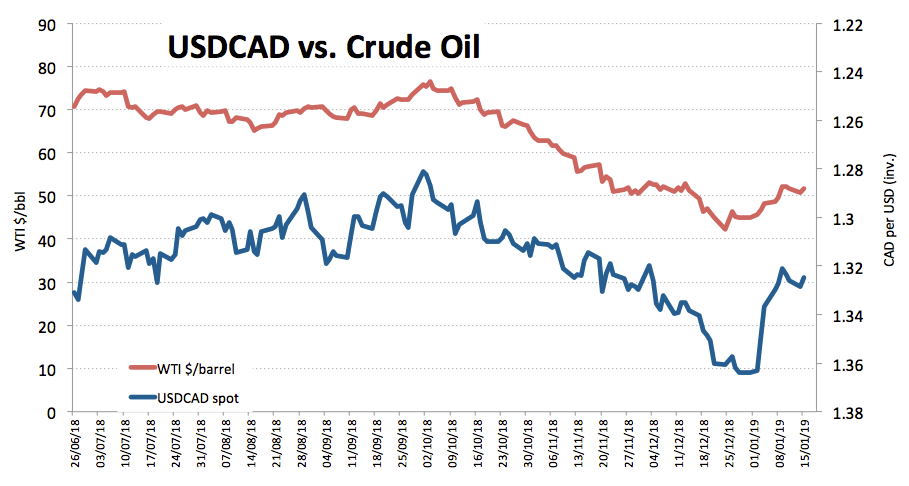
- WTI gains lend extra oxygen to the Canadian Dollar.
- US NY Empire State index disappointed estimates in January.
The Canadian Dollar is trading on a firm note vs. its American peer on Tuesday, dragging USD/CAD to the area of 2-day lows in the proximity of 1.3230.
USD/CAD looks to trade, oil
Spot is down for the first time after three consecutive daily advances on the back of a better tone in the risk-associated/commodity space and the rebound in crude oil prices.
In fact, risk-on sentiment resurfaced during the Asian trading hours following the announcement of further fiscal stimulus in China via larger tax cuts, giving extra wings to stocks and CNY, therefore driving USD/CNY to fresh lows in the 6.75 region during early trade.
The risk-on trade is now sustaining the upside momentum in US stocks and crude oil prices, where the barrel of West Texas Intermediate is gaining more than 2% and approaches the $52.00 mark.
Data wise, US Producer Prices came in below estimates in December, contracting 0.2% inter-month while the Core print dropped 0.1% MoM. Furthermore, the NY Empire State index came in at 3.90 for the current month, also missing consensus.
What to look for around CAD
Further progress in the US-China trade negotiations should prove to be CAD-supportive, as well as any sign that a potential Chinese slowdown could be losing traction. In addition, market participants would look to any changes in the renewed ‘patient and flexible’ stance from either the Federal Reserve or the Bank of Canada. In the near term, however, crude oil dynamics remain poised to rule the mood in CAD.
USD/CAD significant levels
As of writing the pair is losing 0.34% at 1.3239 facing the next support at 1.3208 (2019 low Jan.9) followed by 1.3159 (low Dec.3 2018) and then 1.3080 (200-day SMA). On the other hand, a breakout of 1.3297 (high Jan.14) would expose 1.3327 (38.2% Fibo of October-December up move) and finally 1.3436 (21-day SMA).
Information on these pages contains forward-looking statements that involve risks and uncertainties. Markets and instruments profiled on this page are for informational purposes only and should not in any way come across as a recommendation to buy or sell in these assets. You should do your own thorough research before making any investment decisions. FXStreet does not in any way guarantee that this information is free from mistakes, errors, or material misstatements. It also does not guarantee that this information is of a timely nature. Investing in Open Markets involves a great deal of risk, including the loss of all or a portion of your investment, as well as emotional distress. All risks, losses and costs associated with investing, including total loss of principal, are your responsibility. The views and opinions expressed in this article are those of the authors and do not necessarily reflect the official policy or position of FXStreet nor its advertisers.