US Dollar Index flirts with weekly highs near 97.70 post-data
|- The index moves higher near the 97.70 region.
- Housing Starts rose by 1.235M units in April.
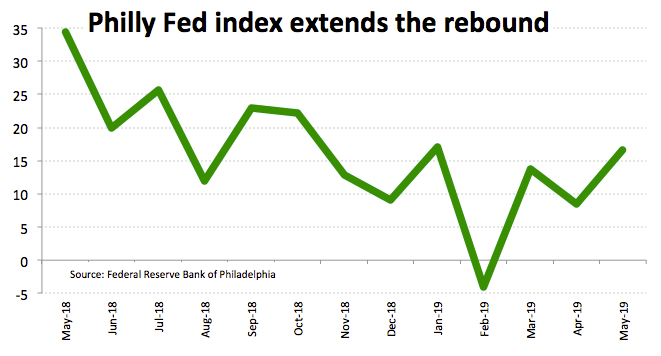
- Philly Fed manufacturing index rose to 16.6 in May.
The US Dollar Index (DXY), which tracks the greenback vs. a basket of its main competitors, is extending the up move to the area of weekly highs near 97.70.
US Dollar Index bid on data
The index is trading in the area of weekly highs around 97.70 in tandem with the rebound in yields of the US 10-year benchmark note and auspicious results in the docket.
In fact, yields are up around 3 bps, targeting the 2.40% after earlier lows in the proximity of 2.35%.
On the calendar, Housing Starts expanded by 1.235M units during April and Bilding Permits rose by 1.296M units, both prints surpassing previous estimates. In the same line, Initial Claims rose at a weekly 212K, taking the 4-Week Average to 225.00K from 220.25K.
Further optimism came in after the always-critical Philly Fed manufacturing index came in at 16.6 for the current month, bettering both expectations and the previous reading.
Looking ahead Minneapolis Fed N.Kashkari (2020 voter, dovish) will discuss Monetary Policy and the Economy.
What to look for around USD
The centre of the debate for the greenback has shifted to the US-China trade dispute, although a high degree of uncertainty as well as caution among investors seem to prevail for the time being. On another direction, the lack of traction in US inflation – and concerns among Fed members – keeps weighing on the buck and threatens its underlying positive prospect. Occasional drops in the greenback, however, are seen shallow as the index stays supported by overseas weakness, the safe haven appeal, favourable yield spreads vs. the Fed’s G10 peers and the status of global reserve currency.
US Dollar Index relevant levels
At the moment, the pair is gaining 0.14% at 97.69 facing the next hurdle at 97.70 (high May 15/16) seconded by 98.10 (high May 3) and finally 98.32 (2019 high Apr.25). On the flip side, a breakdown of 97.03 (low May 13) would expose 96.74 (100-day SMA) and finally 96.33 (200-day SMA).
Information on these pages contains forward-looking statements that involve risks and uncertainties. Markets and instruments profiled on this page are for informational purposes only and should not in any way come across as a recommendation to buy or sell in these assets. You should do your own thorough research before making any investment decisions. FXStreet does not in any way guarantee that this information is free from mistakes, errors, or material misstatements. It also does not guarantee that this information is of a timely nature. Investing in Open Markets involves a great deal of risk, including the loss of all or a portion of your investment, as well as emotional distress. All risks, losses and costs associated with investing, including total loss of principal, are your responsibility. The views and opinions expressed in this article are those of the authors and do not necessarily reflect the official policy or position of FXStreet nor its advertisers.