S&P 500 on track to snap five-month bullish phase
|The S&P 500 finished another week in negative territory, shedding -1.6% (-2.5% MTD). While it is clear that this market remains the domain of buyers, 90% of the upside in March has been reclaimed, and evidence is building for a deeper correction.
Deeper correction possible
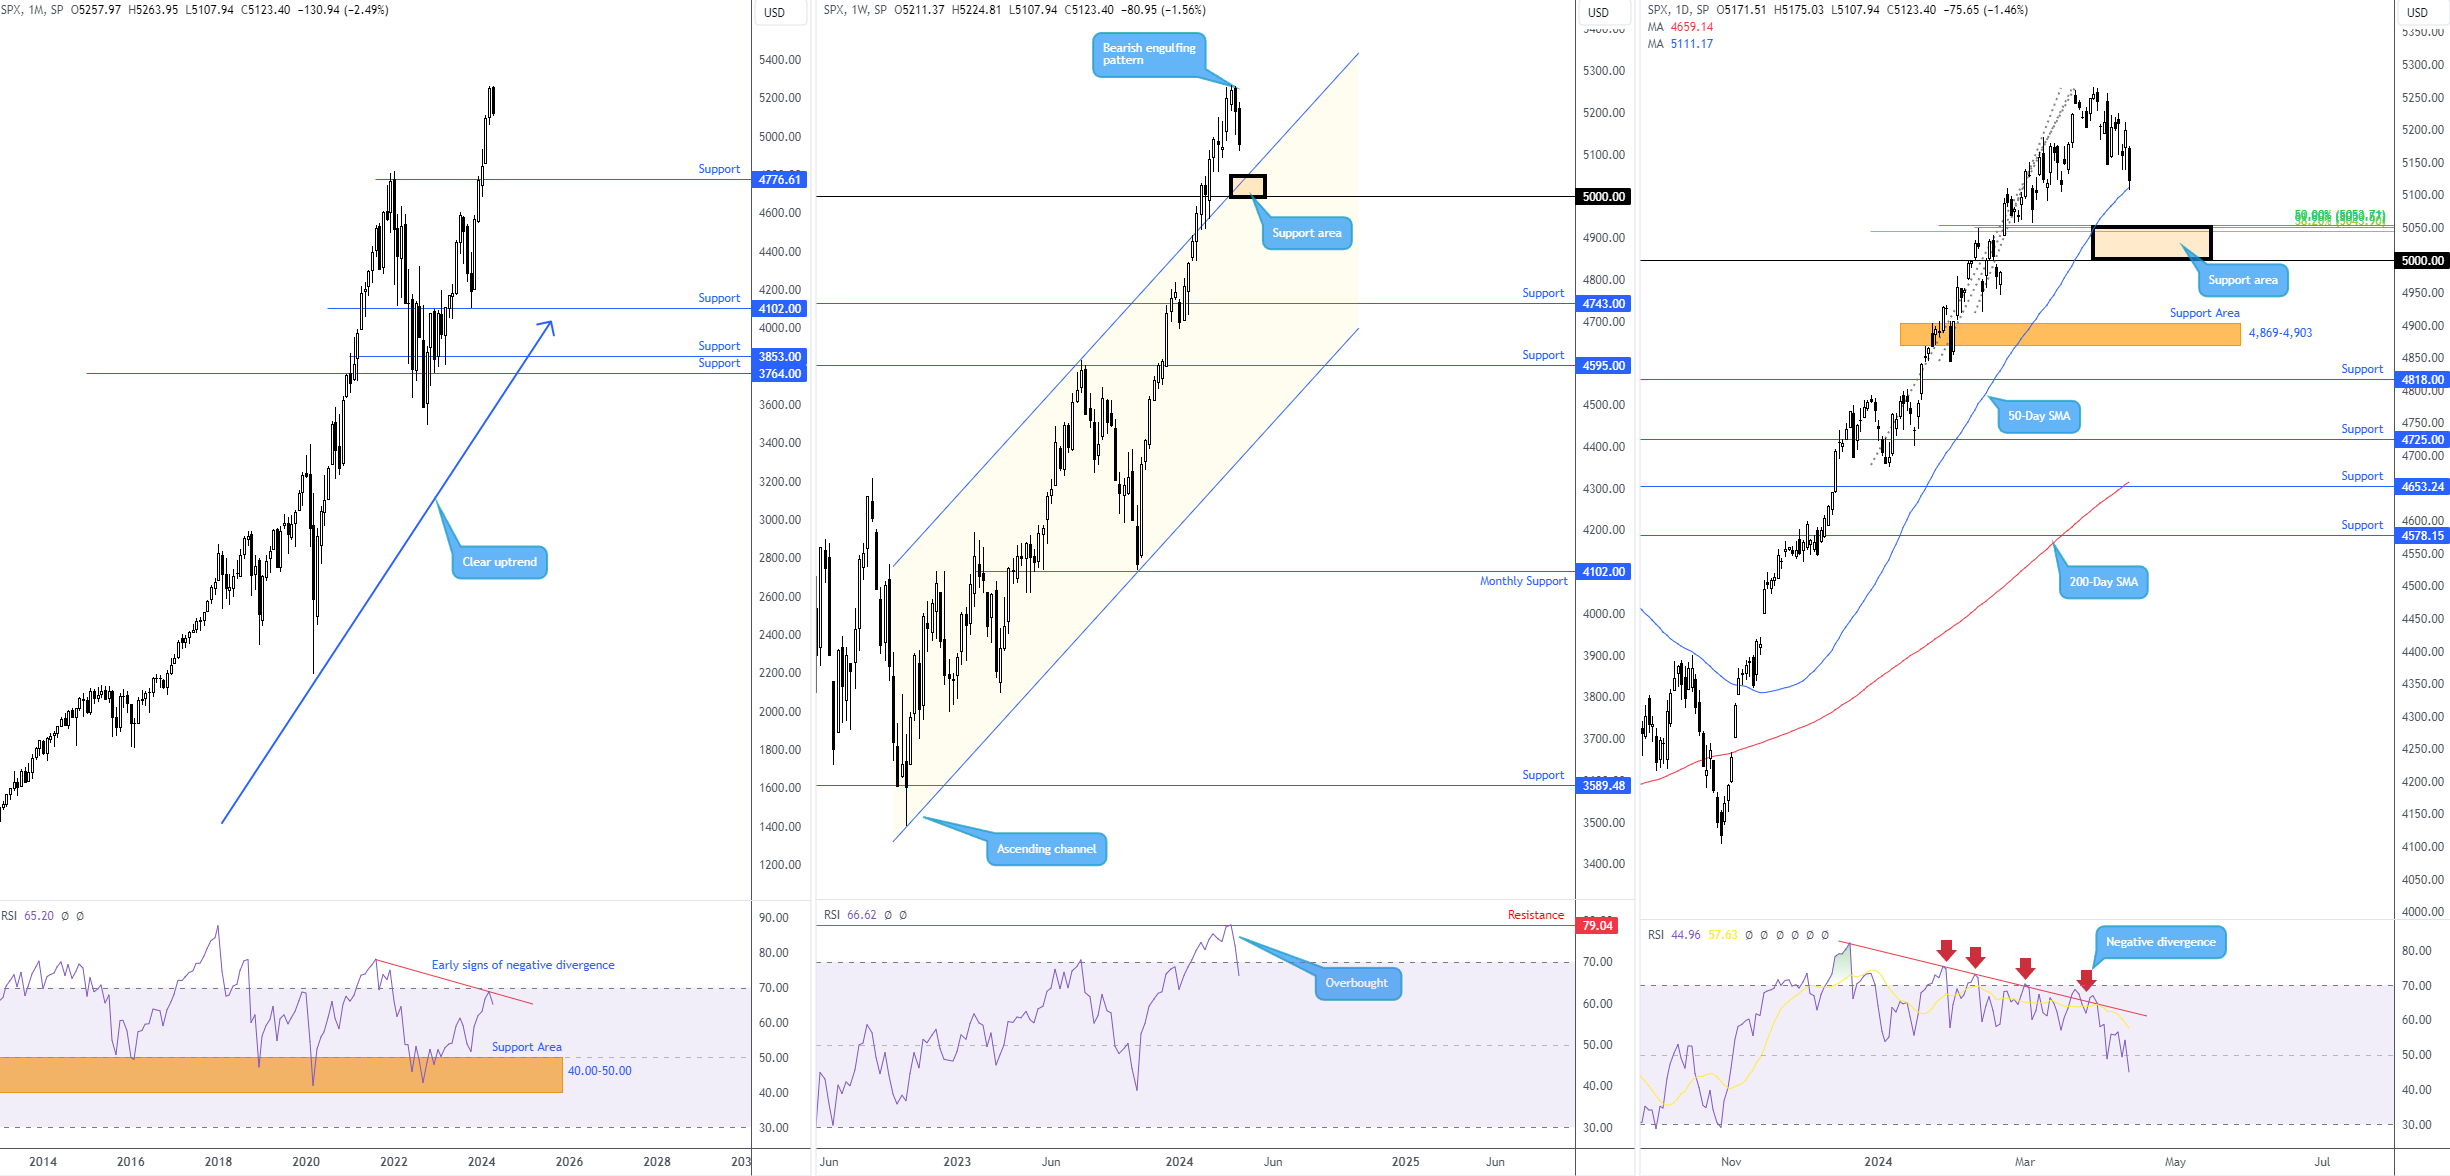
Kicking things off from the monthly chart, following last week’s all-time high of 5,264, there is plenty of scope for a deeper correction to as far south as support at 4,776. Increasing the chances of further downside on the monthly scale is the early signs of negative divergence out of the Relative Strength Index (RSI) ahead of overbought territory.
Moving across a frame to the weekly chart, the RSI also responded from indicator resistance at 79.04 (a level extended from as far back as early 2020) and recently departed from overbought space (a bearish signal for many who follow this oscillator). With respect to price action, following the prior week’s bearish engulfing pattern, last week concluded within a stone’s throw of support made up between the 5,000 level and channel resistance-turned-potential support, taken from the high of 4,607.
Meanwhile, out of the daily timeframe, Friday’s -1.5% fall led the market average to test the mettle of the 50-day simple moving average at 5,111 by the week’s end, positioned just north of a moderate Fibonacci cluster at around 5,050. Although buyers could attempt to defend the simple moving average (mean reversion strategies are likely to take profit here, for example), any rebound is unlikely to be exciting as support commands attention between the 5,000 level and the noted Fibonacci cluster.
Direction this week?
Technically, a deeper correction is likely this week until the 5,000 area, where chart studies suggest buyers could make an appearance in line with the underlying uptrend. The area between the 5,000 level and the channel resistance-turned-potential support on the weekly timeframe, as well as the Fibonacci cluster on the daily chart, is likely to be watched closely for signs of buying this week if tested.
Information on these pages contains forward-looking statements that involve risks and uncertainties. Markets and instruments profiled on this page are for informational purposes only and should not in any way come across as a recommendation to buy or sell in these assets. You should do your own thorough research before making any investment decisions. FXStreet does not in any way guarantee that this information is free from mistakes, errors, or material misstatements. It also does not guarantee that this information is of a timely nature. Investing in Open Markets involves a great deal of risk, including the loss of all or a portion of your investment, as well as emotional distress. All risks, losses and costs associated with investing, including total loss of principal, are your responsibility. The views and opinions expressed in this article are those of the authors and do not necessarily reflect the official policy or position of FXStreet nor its advertisers.