Gold Price Analysis: Bears testing bullish commitments at 200 dma
|- Gold flirting with the 200-DMA as markets await Biden's rescue plan.
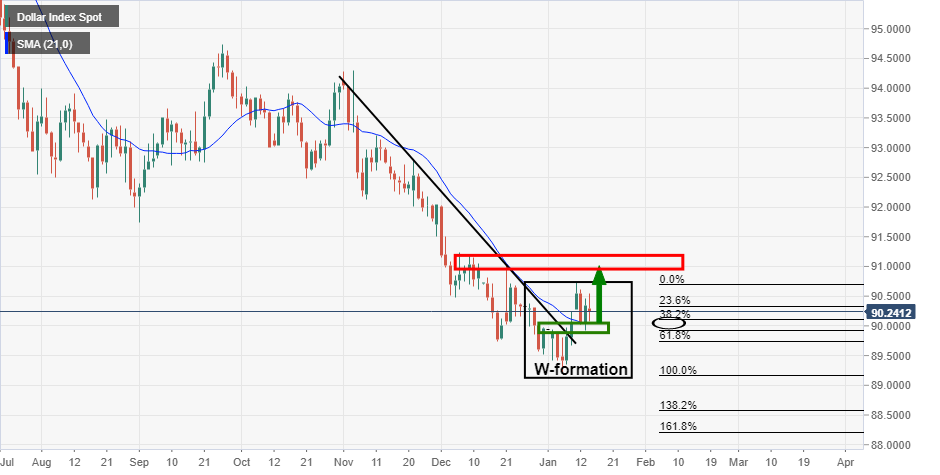
- US dollar correcting as US yields firm on economic recovery hopes.
Further to the prior analysis, Gold Price Analysis: XAU/USD's recovery at odds with the US dollar's daily chart, the price of gold remains anchored.
Rising rates continue to place a wet towel on gold markets with spot gold now flirting with a break below the 200-DMA.
''Complacent positioning in gold is being shaken-up by a rise in rates, and with positioning still stretched, the aggressive rise in Treasury rates is placing continued pressure on the consensus-long gold market, which could still threaten a deeper positioning squeeze,'' analysts at TD Securities explained.
As for the DXY, prospects of higher government spending by President-elect Joe Biden's incoming administration and a vaccine plan has led to a rise in US Treasury yields, supporting the greenback.
The US dollar has also benefitted from expectations of a continued economic recovery in the United States while countries in Europe resort to lockdowns to fend off a second COVID-19 wave.
''This doesn't bode well for gold flows, particularly given that gold is an inflation-hedge asset only inasmuch as the Fed's stance on rates translates into a low rates vol environment,'' the analysts at TD Securities argued.
''However, recent fedspeak has pushed back against the need to immediately extend the weighted-average maturity of their Treasury purchases, suggesting officials are willing to test the resilience of equity markets against higher rates''.
Information on these pages contains forward-looking statements that involve risks and uncertainties. Markets and instruments profiled on this page are for informational purposes only and should not in any way come across as a recommendation to buy or sell in these assets. You should do your own thorough research before making any investment decisions. FXStreet does not in any way guarantee that this information is free from mistakes, errors, or material misstatements. It also does not guarantee that this information is of a timely nature. Investing in Open Markets involves a great deal of risk, including the loss of all or a portion of your investment, as well as emotional distress. All risks, losses and costs associated with investing, including total loss of principal, are your responsibility. The views and opinions expressed in this article are those of the authors and do not necessarily reflect the official policy or position of FXStreet nor its advertisers.