EUR/SEK climbs to 2019 tops above 10.56 post-CPI
|- The Swedish Krona loses further momentum above 10.5600.
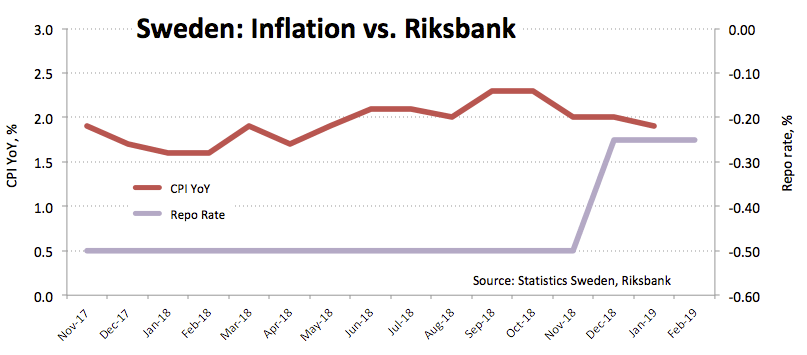
- Consumer Prices rose less than expected in January.
- Housing Starts in Sweden dropped 16% YoY.
The selling pressure is picking up extra pace around the Swedish Krona and is lifting EUR/SEK to fresh 2019 highs beyond 10.5600 the figure.
EUR/SEK up on poor CPI results
The cross gathered further steam today after inflation figures in the Scandinavian economy disappointed expectations during the first month of the year. In fact, headline consumer prices rose 1.9% from a year earlier and contracted 1.0% on a monthly basis. In addition, prices tracked by the CPIF (CPI at constant interest rates) gained 2.0% YoY and dropped 1.0% inte-month.
Additional data saw Housing Starts decreasing 16% on a year to January to 53K units (from 62.879 units).
In the meantime, the cross is trading in levels last seen in early September 2018 around 10.5600 in the wake of today’s releases and is currently breaking above the multi-session sideline theme prevailing since the start of the month.
What to look for around SEK
Fundamentals in the Nordic economy remain healthy, although the projected global slowdown is expected to have its say on the performance of the GDP in Q4 2018/Q1 2019. In addition, SEK is also facing extra headwinds as market participants consider it a funding currency when comes to carry trade. Following the ‘dovish’ hike in December and subsequent messages from the central bank in the same direction, one can assume that a fairly amount of negative news should be already priced in around the Krona. However, concerns over the global slowdown and the ‘wait-and-see’ mode from the ECB should prompt some caution in the Riksbank, pouring cold water over speculations of further tightening this year and thus keeping rallies in SEK somewhat limited.
EUR/SEK levels to consider
As of writing the cross is up 0.96% at 10.5660 and a break above 10.6081 (high Sep.6 2018) would open the door to 10.6929 (high May 4 2018) and finally 10.7290 (2018 high Aug.29). On the flip side, the next support aligns at 10.4834 (10-day SMA) seconded by 10.4036 (low Feb.13) and then 10.3381 (200-day SMA).
Information on these pages contains forward-looking statements that involve risks and uncertainties. Markets and instruments profiled on this page are for informational purposes only and should not in any way come across as a recommendation to buy or sell in these assets. You should do your own thorough research before making any investment decisions. FXStreet does not in any way guarantee that this information is free from mistakes, errors, or material misstatements. It also does not guarantee that this information is of a timely nature. Investing in Open Markets involves a great deal of risk, including the loss of all or a portion of your investment, as well as emotional distress. All risks, losses and costs associated with investing, including total loss of principal, are your responsibility. The views and opinions expressed in this article are those of the authors and do not necessarily reflect the official policy or position of FXStreet nor its advertisers.